Measuring DDoS Mitigation Effectiveness With Real Traffic Data
Vendor benchmarks dodge multi-vector attacks; measure real traffic instead.
DDoS mitigation vendors publish numbers that don't survive contact with a real attack. The fix is a different measurement discipline: four metrics, applied to real traffic, tracked over repeat events instead of a single staged demo. Most buyers still grade vendors on Time-to-Mitigate alone, and that habit is the single biggest reason procurement teams get burned. This piece walks through what the four metrics are, how to set up tracking for them, and how to read the results without getting played by a benchmark built to flatter the seller.
Why the current attack environment makes vendor benchmarks unreliable
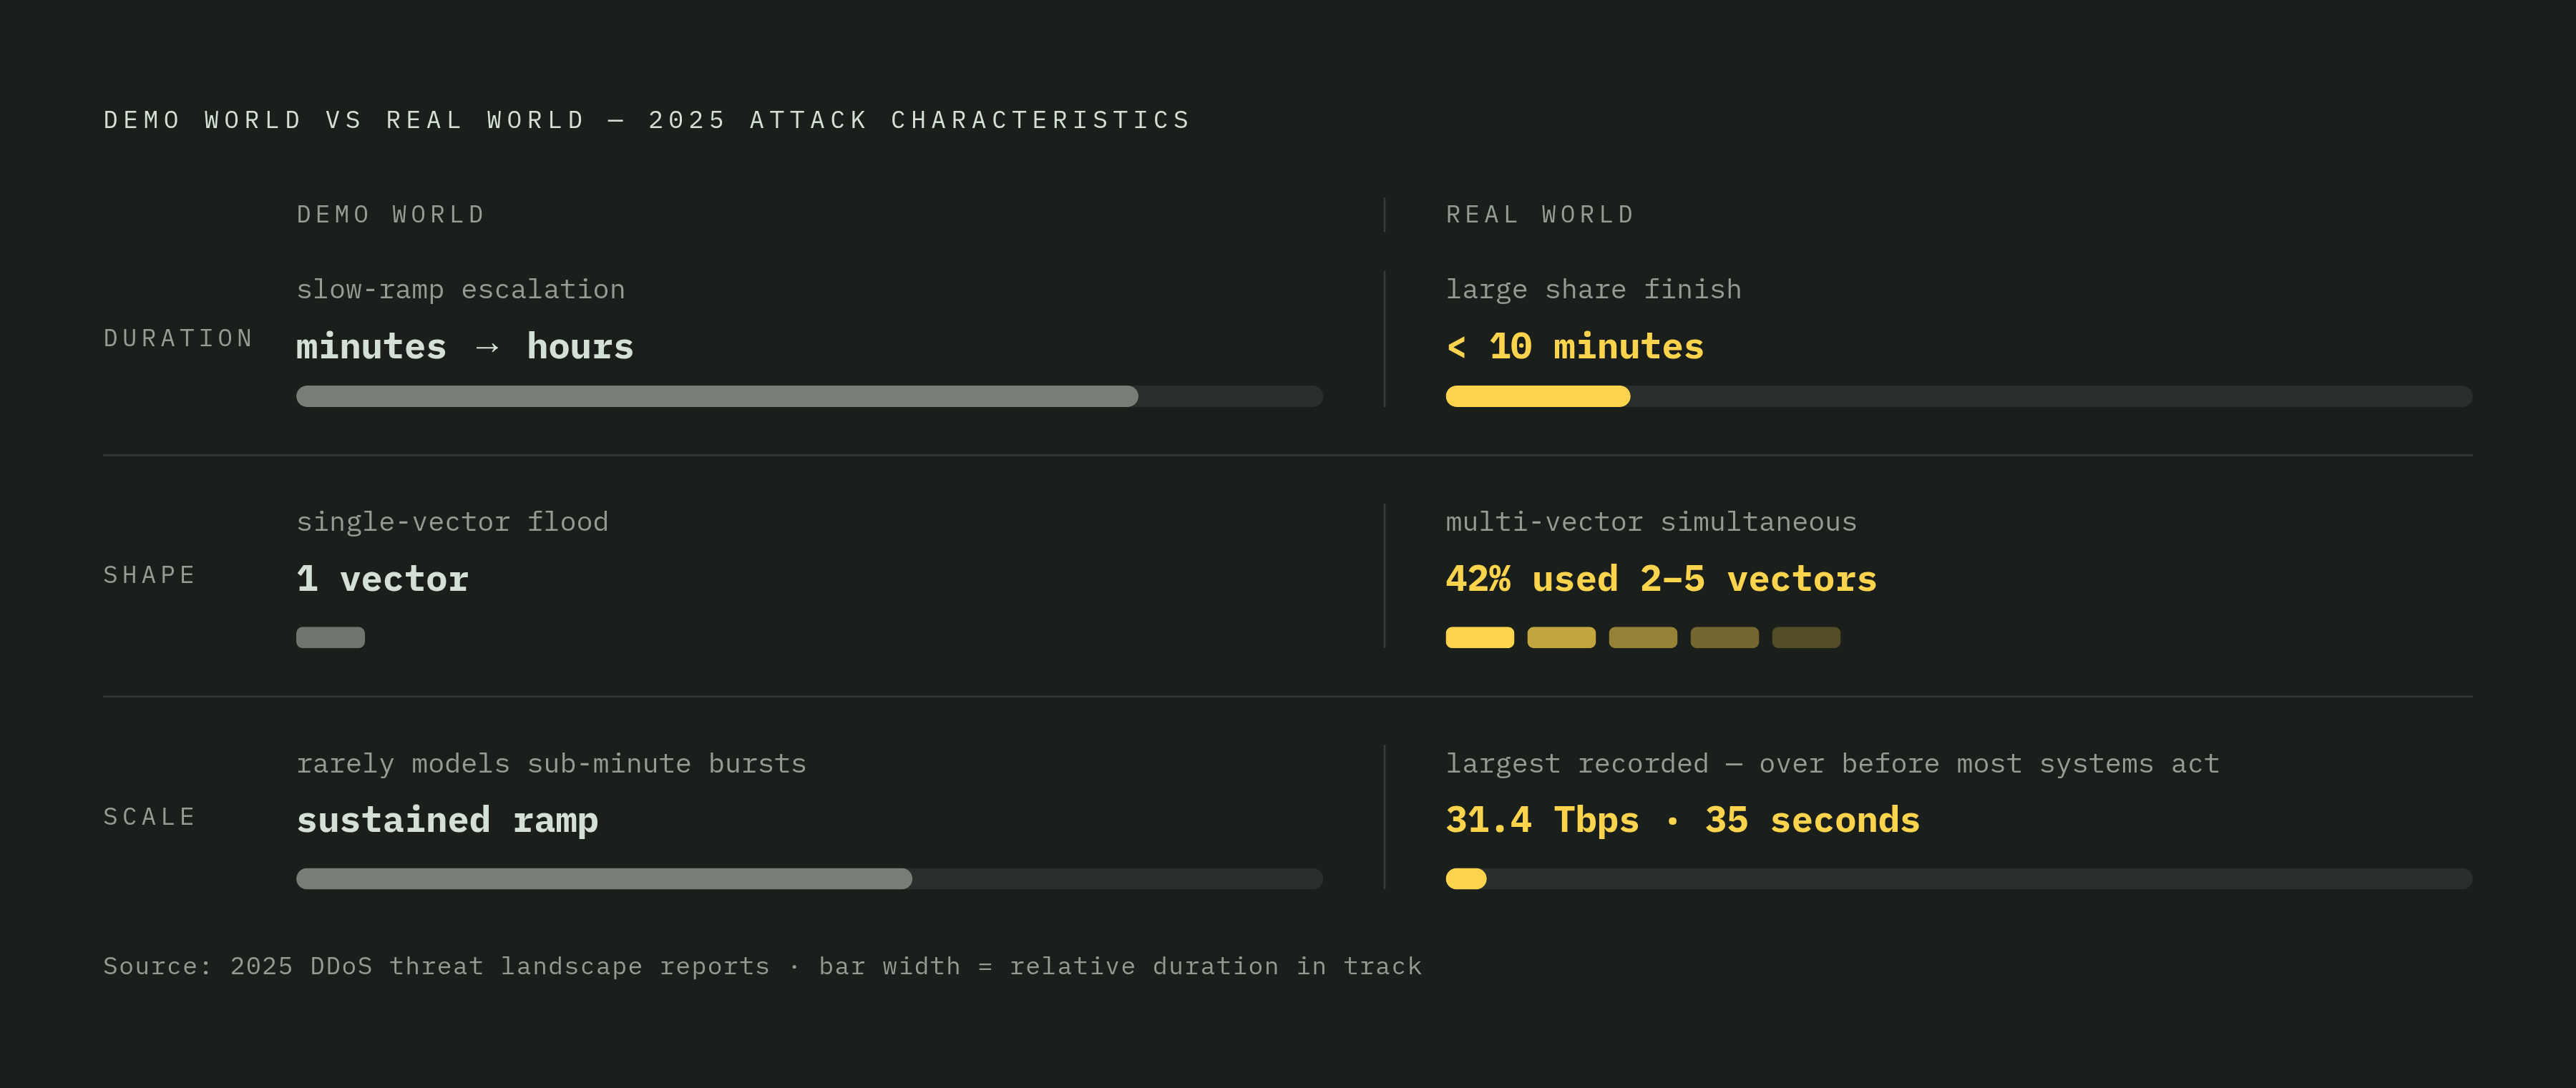
Start with scale. The largest attack ever recorded, the 31.4 Tbps Aisuru botnet event, lasted 35 seconds. Thirty-five seconds. A benchmark that doesn't model sub-minute bursts at terabit scale is measuring something that no longer shows up on the wire.
Duration makes it worse. A large share of DDoS attacks now finish in under 10 minutes. That's hit-and-run timing, and it breaks the detection windows most vendor demos are built around: the slow-ramp, gradually escalating traffic pattern that gives a human analyst time to notice, confirm, and act. Real attackers don't wait around for triage. A demo that assumes they will is showing off a world that stopped existing a while ago.
Then there's the shape of the attack. Close to 42% of 2025 attacks used two to five distinct vectors at once, layering protocol floods with application-layer requests and amplification traffic, often shifting mid-attack. A single-vector flood test says nothing about how a system handles that kind of layered, shifting pressure, because nobody actually faces a single-vector flood anymore.
Vendor benchmarks are built to make the vendor's own product look good, and on that narrow goal they succeed. Real traffic is multi-vector, burst-heavy, and moving faster than any human review cycle. A measurement framework that ignores this is measuring the wrong thing, accurately, which is arguably worse. It's measuring the wrong thing, accurately, which is arguably worse.
The four metrics that reveal mitigation quality
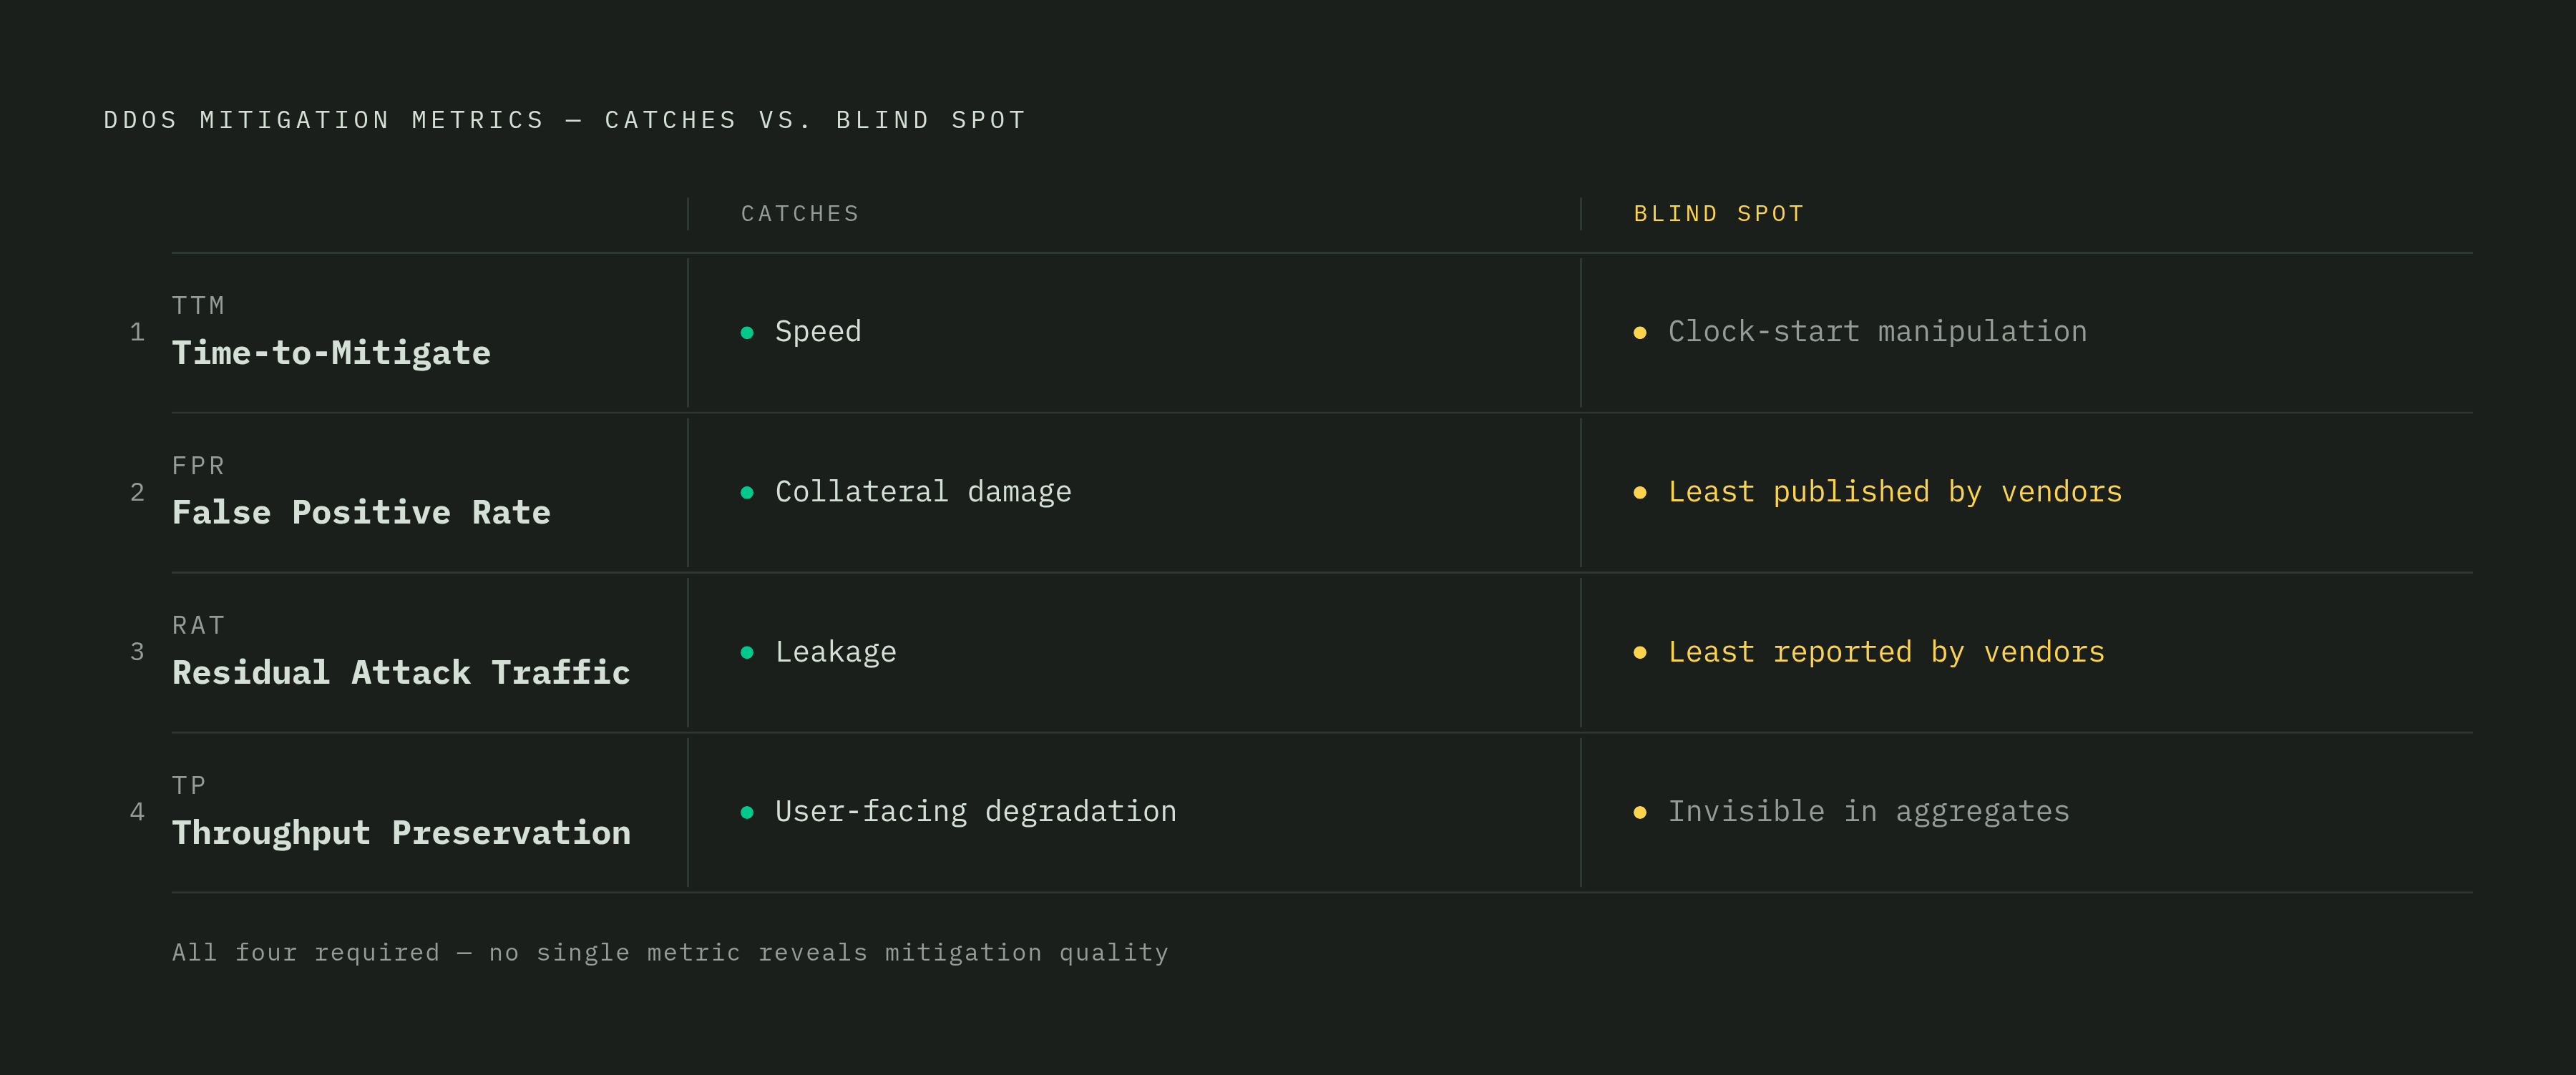
Not every number a vendor reports deserves the same attention. Four metrics matter, and each one catches something the other three miss.
Time-to-Mitigate (TTM) is the clock from detection to enforced rule. Peer-reviewed work matters here: Anomaly2Sign research reports TTMs below 1.5 seconds, and other studies put the figure below 7 seconds. Those are the numbers to hold a vendor against, with one catch covered further down: where the clock starts changes what the number actually means.
False Positive Rate, sometimes called Collateral Damage, measures the share of legitimate traffic an enforced rule blocks. This maps straight to lost revenue, and it's a separate question from raw accuracy. A system can catch nearly all attack traffic and still wreck real user sessions doing it, so high accuracy and high collateral damage sit as two separate scores on two separate tests.
Residual Attack Traffic (RAT) is the mirror image: the share of attack packets or flows that still reach the victim network after rules go live. It captures the leak, the stuff that got through anyway, and it's the number vendors publish least often. That's not an accident.
Throughput preservation rounds out the set, tracking whether legitimate request latency and completion rates hold steady while a mitigation event runs. A system can win on TTM, RAT, and false positives, and still leave real users staring at five-second page loads during the attack window. Read all four together, because a strong result on one tells you nothing about the other three.
How to instrument real traffic for meaningful measurement
None of the four metrics above comes out of alert counts. Measuring them for real means pulling flow data, routing information, performance test results, and network metrics continuously, not logging "mitigation triggered" once and calling it done.
Always-on inline deployments produce continuous TTM and RAT readings, since the mitigation path already sits inside the traffic flow. On-demand or scrubbing-center models add a diversion lag, the time it takes to reroute traffic into the scrubbing pipeline, and that lag has to get measured separately and folded into the TTM number. Skipping that step leaves the TTM figure looking clean while it quietly misses a real chunk of the delay.
Four checkpoints structure the work: detection, response, filtering, analysis. Detection gets timestamped the moment an anomaly is flagged, anchoring the front end of the TTM calculation. Response gets timestamped when the mitigation rule actually goes live, closing out the TTM calculation. Filtering needs continuous sampling of legitimate traffic sessions throughout the event, not just before and after, since this is where collateral damage and throughput preservation get measured, and it's also the stage most practitioners under-instrument. Analysis happens afterward, covering RAT and any vector that slipped past detection.
None of it works without per-flow telemetry. Aggregate bandwidth counters show a spike in total traffic volume, but they can't tell an attack flow from a legitimate session sitting right next to it. Only session-level flow records let you separate the two and put a real number on collateral damage or residual attack traffic.
Reading Time-to-Mitigate numbers honestly
Sub-second and single-digit TTM claims come with fine print most vendors leave off the slide. The Anomaly2Sign figure below 1.5 seconds and the broader research figure below 7 seconds both describe automated, AI-driven pipelines running inline. Neither describes an on-demand system, and neither describes a workflow with a human sitting in the loop. A vendor quoting the faster number without naming the architecture that produces it is quoting a number that has nothing to do with what's actually for sale.
Where the clock starts matters as much as the pipeline itself. TTM can get measured from the first anomaly signal, from the moment a threshold gets crossed, or from human escalation, and those three starting points produce three different numbers from the exact same incident. Vendors gravitate toward whichever definition shrinks the number, which is the whole reason to ask, in writing, which clock they're running before comparing anything.
The 35-second Aisuru attack belongs in this conversation as a ceiling, nothing more. That figure describes total attack duration, and its use is simple: a fully automated system that can't act inside that window won't matter for an attack shaped like this one.
The hit-and-run statistic reframes the whole argument. If a large share of attacks finish inside 10 minutes and a system's TTM runs in minutes rather than seconds, most of those attacks will have already done their damage, or simply ended, before the rule ever gets enforced. Past a certain threshold, TTM marks the line between a mitigation system doing something and doing nothing.
Measuring false positives with real traffic, not test suites
False positive rate is the metric vendors publish least and practitioners test least, even though it burns revenue faster than anything else on this list, cutting into completed logins and checkouts in real time. A blocked login page doesn't care how good the RAT number looked that day.
Test suites fail here for a structural reason: the traffic profiles in a vendor's own test suite are already known to that vendor's classifier, because the vendor built the suite and tuned the classifier against it. Real traffic doesn't play along. It carries odd geographic patterns, legitimate scraper activity, and API clients sending non-standard headers, exactly the edge cases nobody designed the classifier around. False positive rates rise when real traffic appears, carrying odd geographic patterns, legitimate scraper activity, and API clients sending non-standard headers, exactly the edge cases nobody designed the classifier around.
AI agent traffic makes the gap obvious right now. DataDome's network recorded close to 8 billion AI agent requests in the first two months of 2026, hitting form pages 64% of the time, login endpoints 23% of the time, and checkout flows 5% of the time. Behavioral classifiers built before this traffic pattern existed have no reliable way to tell an authorized AI agent from a bot attack. A system tuned to be aggressive about bots will flag a lot of legitimate agent activity along the way, and it'll keep doing it until someone retrains it.
UC Davis research on this exact problem found a commercial provider correctly identified only 1 out of 7 tested AI browsing agents, a high false negative rate, while specialized behavioral classifiers performed substantially better on the same agents. The inverse failure, blocking legitimate agents that should have gone through, is just as likely and much harder to catch, since a blocked legitimate request doesn't announce itself the way a successful attack does.
Assessing throughput preservation under peak attack load
Every minute of degraded service during an attack carries a dollar figure, even when the degradation is partial rather than a full outage. That's what makes throughput preservation the most boardroom-legible of the four metrics. Nobody up there needs RAT explained to them, but everybody understands checkout latency, immediately and in their gut.
Raw network capacity numbers get thrown around constantly in vendor decks, and they only matter to the extent they translate into zero degradation for legitimate traffic while an attack is actively running. Capacity is a ceiling and nothing more. It says nothing about whether the system holding that ceiling up keeps latency flat for someone trying to load a page mid-event.
Use the same canary traffic approach described earlier: track legitimate request latency and completion rates before, during, and after a mitigation event, watching for latency spikes or rising error rates during the active window specifically, not the aggregate average across the whole incident. Averages bury the worst thirty seconds, and the worst thirty seconds is exactly when a customer decides to leave.
One reported data point puts this in perspective. 41 attacks above 100 Gbps hit in a single month, a 78% jump over the prior month. That scale of sustained mitigation activity is the bar to hold every vendor's evidence against when evaluating throughput preservation under peak load.
Making results reproducible across attack events
One good result from one attack is an anecdote, not evidence. Reproducibility means running the same measurement protocol, the same four checkpoints, the same telemetry capture, across every attack type and every stretch of time a network actually sees.
Post-attack analysis needs to run as a standing procedure, on a schedule, not just after a bad week. Each of the four stages (detection, response, filtering, analysis) should throw off structured records: timestamps, traffic volumes broken out by category, rule counts, session outcomes. Stored consistently, that data lets someone compare incidents six months apart instead of relying on memory and a vendor's incident report, which gets written to make the vendor look good.
Repeat attacks make this easier than it sounds, if only because there tend to be so many of them. More than 70% of targeted organizations get hit again, averaging 2.8 follow-up attacks. Most organizations end up sitting on a real longitudinal dataset just by staying in business, no artificial test conditions needed.
Tracked over time, Mean Time to Detect and false positive rates reveal something a single incident report never will: whether the mitigation system actually learns from each attack, or holds static against a threat landscape that keeps shifting around it regardless. That difference, a system that matures versus one that passed an initial audit and then stalled, is the entire point of measuring any of this.