Debugging and Observability for Agentic Pipelines
Traditional monitoring assumes determinism agents simply don't offer.
Agentic pipelines break monitoring because they break the three things monitoring assumed it could rely on: deterministic execution, stateless requests, known control flow. A traditional API call is boring in the best way. You know what code ran, you know why, and if something breaks, a stack trace tells you where. An agent runs for hours, holds state across days, and might take a completely different reasoning path on the same input twice in a row. Counters and latency histograms were built for a world where "the request succeeded" meant something. That world doesn't have agents in it.
Determinism used to buy you a lot. If you knew the input and the code path, you knew the output, and a green dashboard meant something because a passing health check reflected a real, stable state. Agents swap that certainty for something closer to a probabilistic simulation running live in production. An autonomous coding agent might chew through a task for six hours, call a dozen tools, revise its own plan three times, and land on an answer that looks fine and is wrong, with nothing crashing and no error firing anywhere. The dashboard stays green the whole time. A passing signal used to mean the system worked; now it just means nothing tripped an alarm. Treat those as the same thing and you get broken agents that ship to production and quietly stay there for weeks.
The failure modes that only appear at the session level
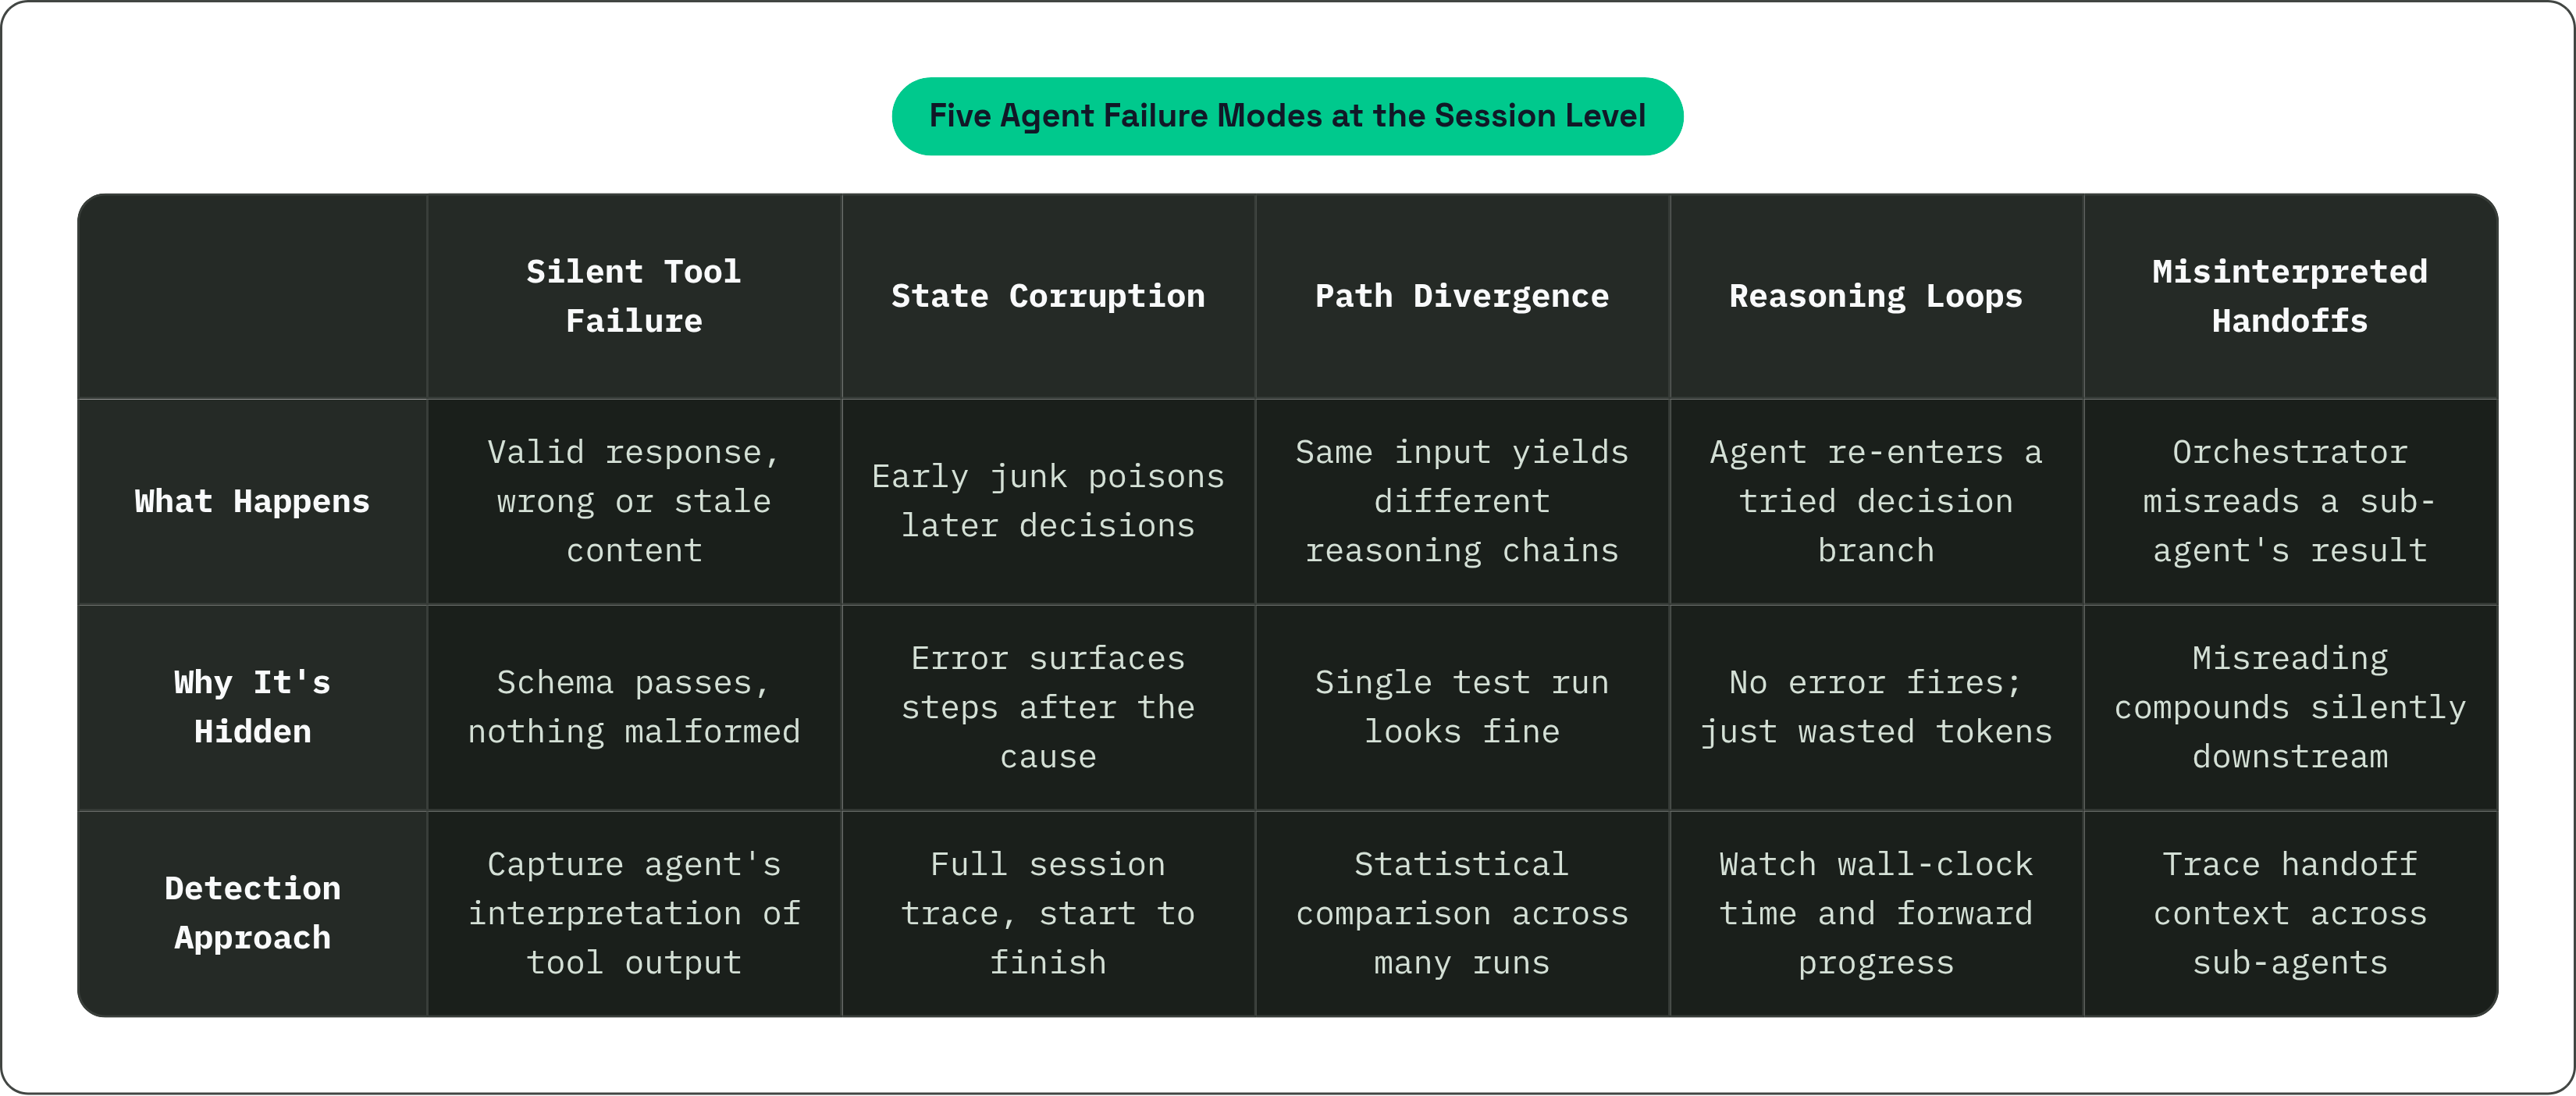
Agent failures are mostly logical, not technical. No exception thrown, no non-200 status, no spike on the error-rate graph. The pipeline runs start to finish, hands back an answer that's confidently wrong, and every system watching it reports a clean bill of health.
Five patterns come up often enough to name, and the first one is the nastiest. Silent tool failure: a tool returns a response that's structurally valid, JSON parses fine, schema checks out, but the content is wrong or stale, and the agent builds its next three decisions on top of it. Nothing alerts, because nothing was malformed. State corruption is quieter still: junk that entered the context five steps ago sits there poisoning every decision after it, and no per-request metric shows you step five, because by the time something looks wrong you're staring at step twelve. Non-deterministic path divergence means you can run the exact same input twice and get two meaningfully different reasoning chains, so one test run tells you almost nothing about how the agent behaves in general. Reasoning loops happen when an agent walks back into a decision branch it already tried, burning tokens and wall-clock time while making zero forward progress. In multi-agent setups, misinterpreted handoffs let one sub-agent return a result that the orchestrator reads wrong, and that misreading compounds every step downstream.
None of these five show up in individual request metrics. You catch them by reading the full session, start to finish, as a story instead of a stream of isolated events. And because a lot of these failures are non-deterministic, a failure that shows up once in twenty runs is a different risk than one that shows up every time. Telling those apart takes statistical comparison across many runs, not one careful replay. Most teams still only budget for the replay.
What observability for agents actually has to capture
Agent observability is the ongoing practice of tracing, monitoring, and evaluating the full reasoning and execution path an agent takes. The goal is explaining why the system decided what it decided, beyond confirming the service stayed up.
Traces need to reconstruct the entire reasoning and execution chain across a session, not just what went in and what came out at the edges. Tool calls need to be captured as spans: inputs, outputs, latency, and, this part gets skipped constantly, how the agent interpreted the result. A tool can return correct data that the agent still reads wrong, and if you're not capturing the interpretation, you'll never catch that. Decision steps mean capturing the intermediate reasoning the model produced before it acted, so you can go back later and see why it picked the path it picked. Failures need classification tied to the exact step that caused them (silent, logical, state-based) instead of getting dumped into one generic error bucket where they're indistinguishable and useless.
The data this produces has to support debugging and auditing at once. Debuggability means any failure traces back to the specific decision, tool call, or data access responsible for it. Auditability means every action gets logged with the context, the policy, and the data it touched, which matters to compliance teams as much as to engineers staring at a broken pipeline at midnight. A platform that logs LLM calls but can't tie a call to its parent agent step, can't show tool calls as spans, and can't replay a session as a reasoning chain is missing the parts that actually define observability. Sales decks blur this line constantly. The distinction stops being academic the moment something breaks in production and you need an answer, not a demo.
How OpenTelemetry is becoming the structural backbone for agent traces
The industry is converging on OpenTelemetry as the shared schema for LLM and agent traces, and that convergence is the only reason multi-vendor observability stacks are becoming realistic instead of theoretical.
The spec defines four span types built for agents specifically: createagent, invokeagent, invokeworkflow, executetool. Each maps to a distinct layer of what an agent does, which saves you from reverse-engineering structure out of a pile of generic log lines. One detail worth knowing: an invoke_agent span gets marked CLIENT when the agent runs remotely, say through a managed API like OpenAI's Assistants or AWS Bedrock Agent, and INTERNAL when it runs inside your own process, like a LangChain or CrewAI agent. That distinction decides where latency and errors get attributed, and it matters a lot when you're trying to figure out whose infrastructure actually slowed things down.
Getting started doesn't take much. In Python, one line of instrumentation gets you semantic-convention-compliant spans without hand-building any of them. Datadog picked up the OTel GenAI conventions natively and maps its gen_ai.* attributes straight into its own LLM Observability schema, which is a decent signal that this standard carries enough weight to shape how major platforms build their roadmaps.
The caveat, and it's a real one: OpenTelemetry gives you the call graph, the skeleton of what happened, step by step. It cannot tell you if what happened was any good. That judgment call needs an evaluation layer sitting on top, because no volume of span data substitutes for it. Distributed setups make even the tracing part harder. A session might cross your application, an MCP server, an inference endpoint, and two or three external integrations before it produces an answer, and the trace has to survive every one of those hops intact.
Where the current tooling landscape actually helps and where it leaves gaps
Tracing tools tell you what happened; evaluation tools tell you if it was good. Most platforms are strong at one and mediocre at the other, and teams need both wired into the same pipeline, which is a harder ask than it sounds on a vendor call.
LangSmith pairs tracing with evaluation better than most. Its natural-language trace assistant lets an engineer type "why did the agent loop here?" and get a real answer pulled from trace data, and instrumentation overhead stays low enough to hold up in latency-sensitive production settings. Braintrust took a different angle: it captures production traces and turns them into a dataset for testing prompt changes before they ship, an "evals as CI" pattern where every prompt change runs against a sample of real production traces before merging. That pattern has caught on well beyond Braintrust's own user base. Laminar keeps overhead close to nothing, a fit for production environments where every millisecond of latency budget is already spoken for. Langfuse, self-hosted or cloud, is a reasonable starting point: trace capture, a debugging UI, short setup time. Paired with decent structured logging, it's a sane first layer for a team instrumenting its first production agent.
There's a volume wall every team hits eventually. Past a certain scale, nobody's reading traces by hand anymore, and you need automated pattern detection to catch which retrieval queries keep returning garbage or which tool call sequences correlate with failures. That's a clustering problem, not a "someone reads the logs" problem, and a lot of teams don't realize they've crossed that line until the logs pile up past the point anyone can honestly claim to review them.
The bigger gap sits underneath all of this. Even the best tracing platform can't tell you, from latency numbers alone, whether the retrieval agent picked the right data source or the summarizer made something up. That needs a purpose-built evaluation layer scoring outputs for faithfulness, factual accuracy, and policy compliance, ideally without shipping every output to an external API just to grade it. Most stacks don't have this yet. Security belongs in the same pipeline too, since a trace can look completely clean and still be hiding an injected instruction. Prompt injection detection needs to sit inside the eval gate, not off in some isolated tool that nobody remembers to check.
The four debugging primitives that make production agent failures actionable
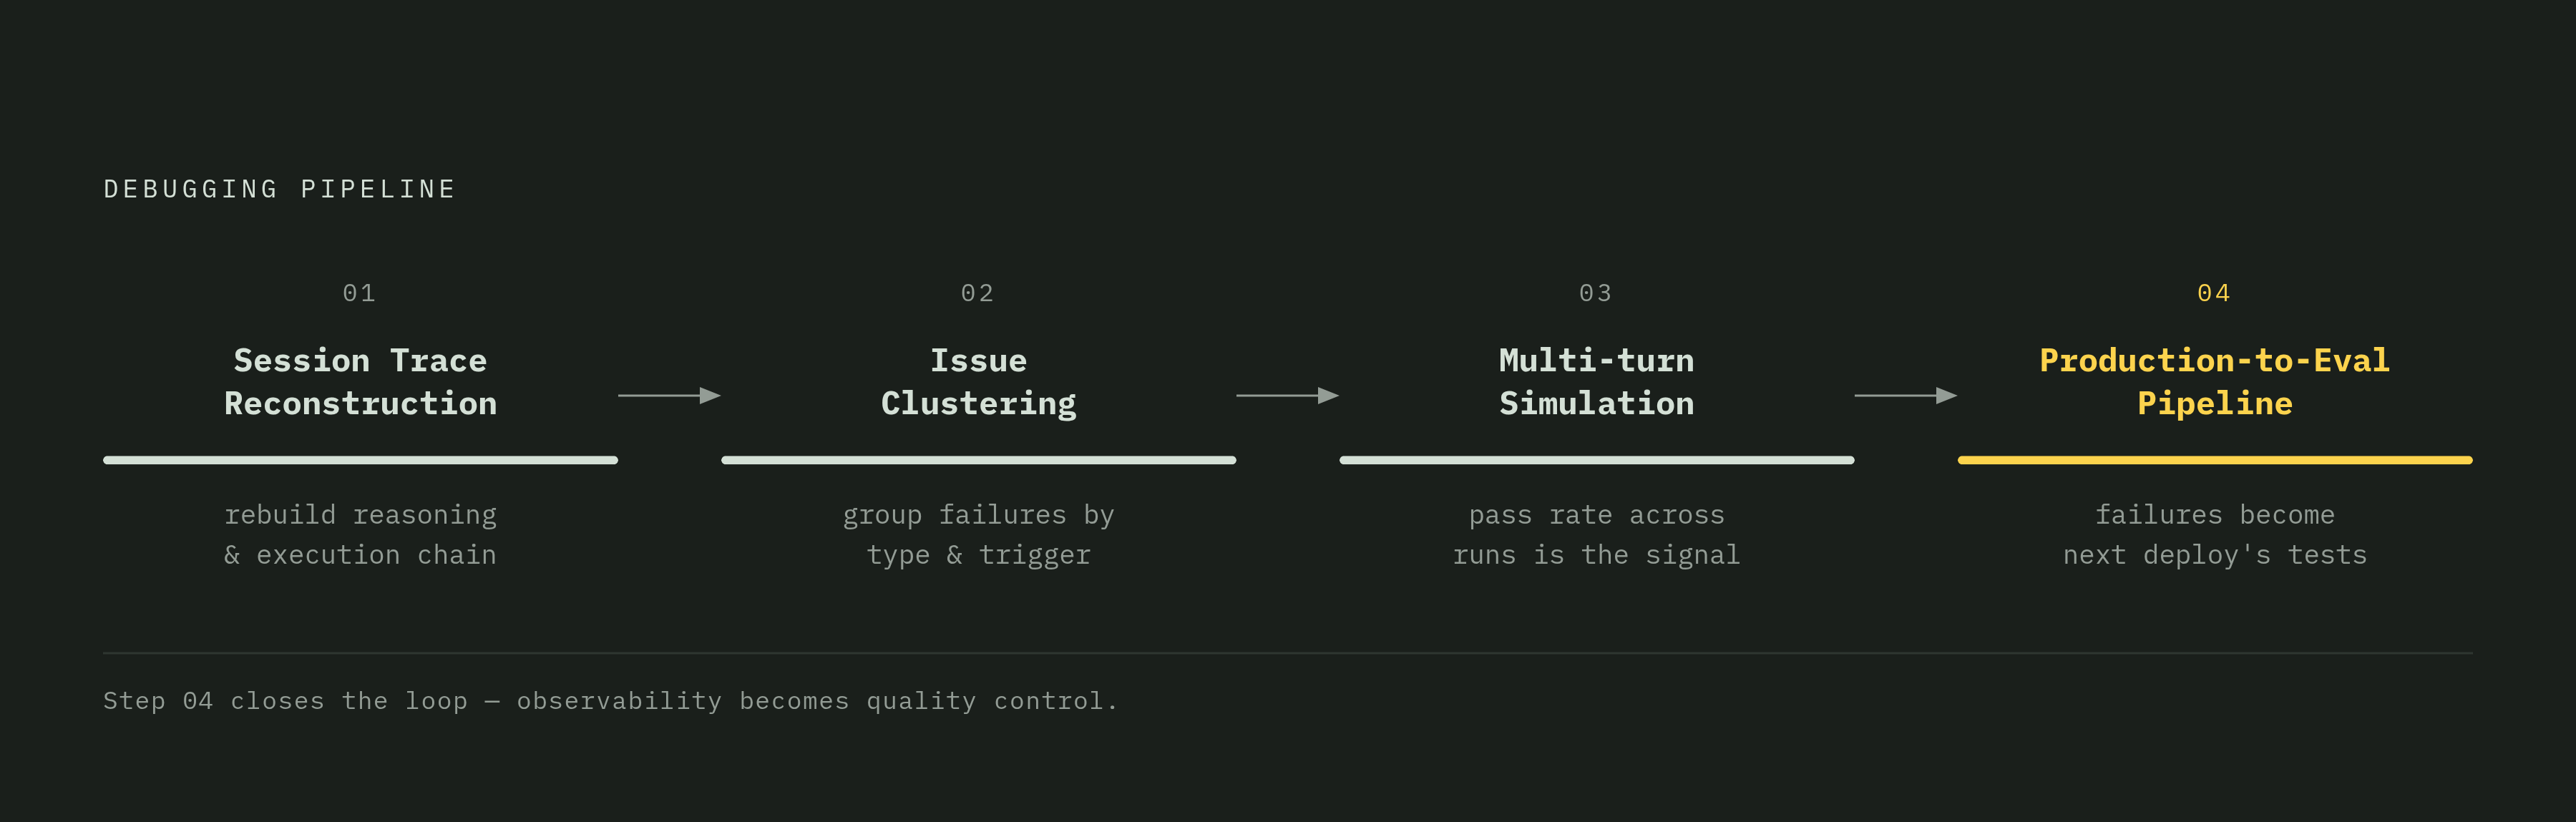
Four primitives, applied roughly in this order, turn a failed session from a mystery into a fixable bug.
Full session trace reconstruction comes first: rebuild the complete reasoning and execution chain for a session that failed. Skip this and root cause analysis is just guessing with extra steps. Issue clustering groups failures by type and trigger across many sessions, because at real production volume you stop reading individual traces and start hunting for which prompt variant, which retrieval query, or which tool sequence keeps showing up next to bad outcomes. Multi-turn simulation means running the same scenario many times instead of once; a scenario that passes 18 out of 20 runs is a different animal than one that fails every time, and the pass rate across runs is the signal that actually matters, not any single lucky or unlucky run. A production-to-eval pipeline closes the loop: failed traces from production become the test set for the next prompt or model change, so what broke last week is exactly what gets checked before next week's deploy ships.
The systematic-versus-stochastic split matters more than any of the four primitives on its own. A systematic failure has one root cause and needs a model or prompt fix. A stochastic failure is just variance, and the fix looks more like adding retries or fallbacks than rewriting a prompt. You can't tell which one you're looking at from a single run, full stop, because the comparison across runs is what tells them apart.
These primitives apply at two layers. At the application layer: user intent classification, session-level analytics, end-user feedback. At the orchestration layer: guardrail effectiveness, prompt cache hit rates, which model got picked for which request, fallback execution, how a multi-step chain performs end to end. Teams that build tracing but skip the production-to-eval loop are sitting on data they can look at but never act on. The loop is what turns observability from a diagnostic habit into an actual quality control process.
What the infrastructure layer has to provide for agent observability to work
Here's the underlying problem: agents are stateful, long-running, and multi-step, and the cloud's default model, one app serving many stateless requests, was never built for an agent instance holding its own state across a session that lasts hours.
Stateful agent execution needs a few things at the platform level. Persistent storage per agent instance, not per request, so an agent can resume after a pause or a crash without losing its place. Durable execution, meaning pipelines that can retry, sleep, wait on a human approval, and resume later without losing progress, ideally without costing anything while they wait. Real-time interfaces, WebSockets or something equivalent, so a person can actually watch or step into a running session. Scheduling primitives round it out: alarms and timers, so an agent can act on a schedule instead of only reacting to whatever request just showed up.
The observability payoff is direct. A control plane sitting above individual model providers and tools, one place that proxies every request and hands you logging, routing, and cost tracking automatically, is a lot easier to observe than a pile of point solutions each keeping its own logs in its own format. Cloudflare's AI Gateway is built around that idea: one observability and billing layer with dynamic routing across both Workers AI (Cloudflare's own managed inference on its GPU fleet) and outside providers, so every model call is visible in one place no matter who served it. When a lot of agents run at once, each one needs real isolation, so a crash or a bad state in one can't leak into another. Fast-starting isolate-based sandboxes matter more here than containers do, because agent workloads cold-start constantly at scale.
Why MCP at scale introduces a governance problem that observability alone cannot solve
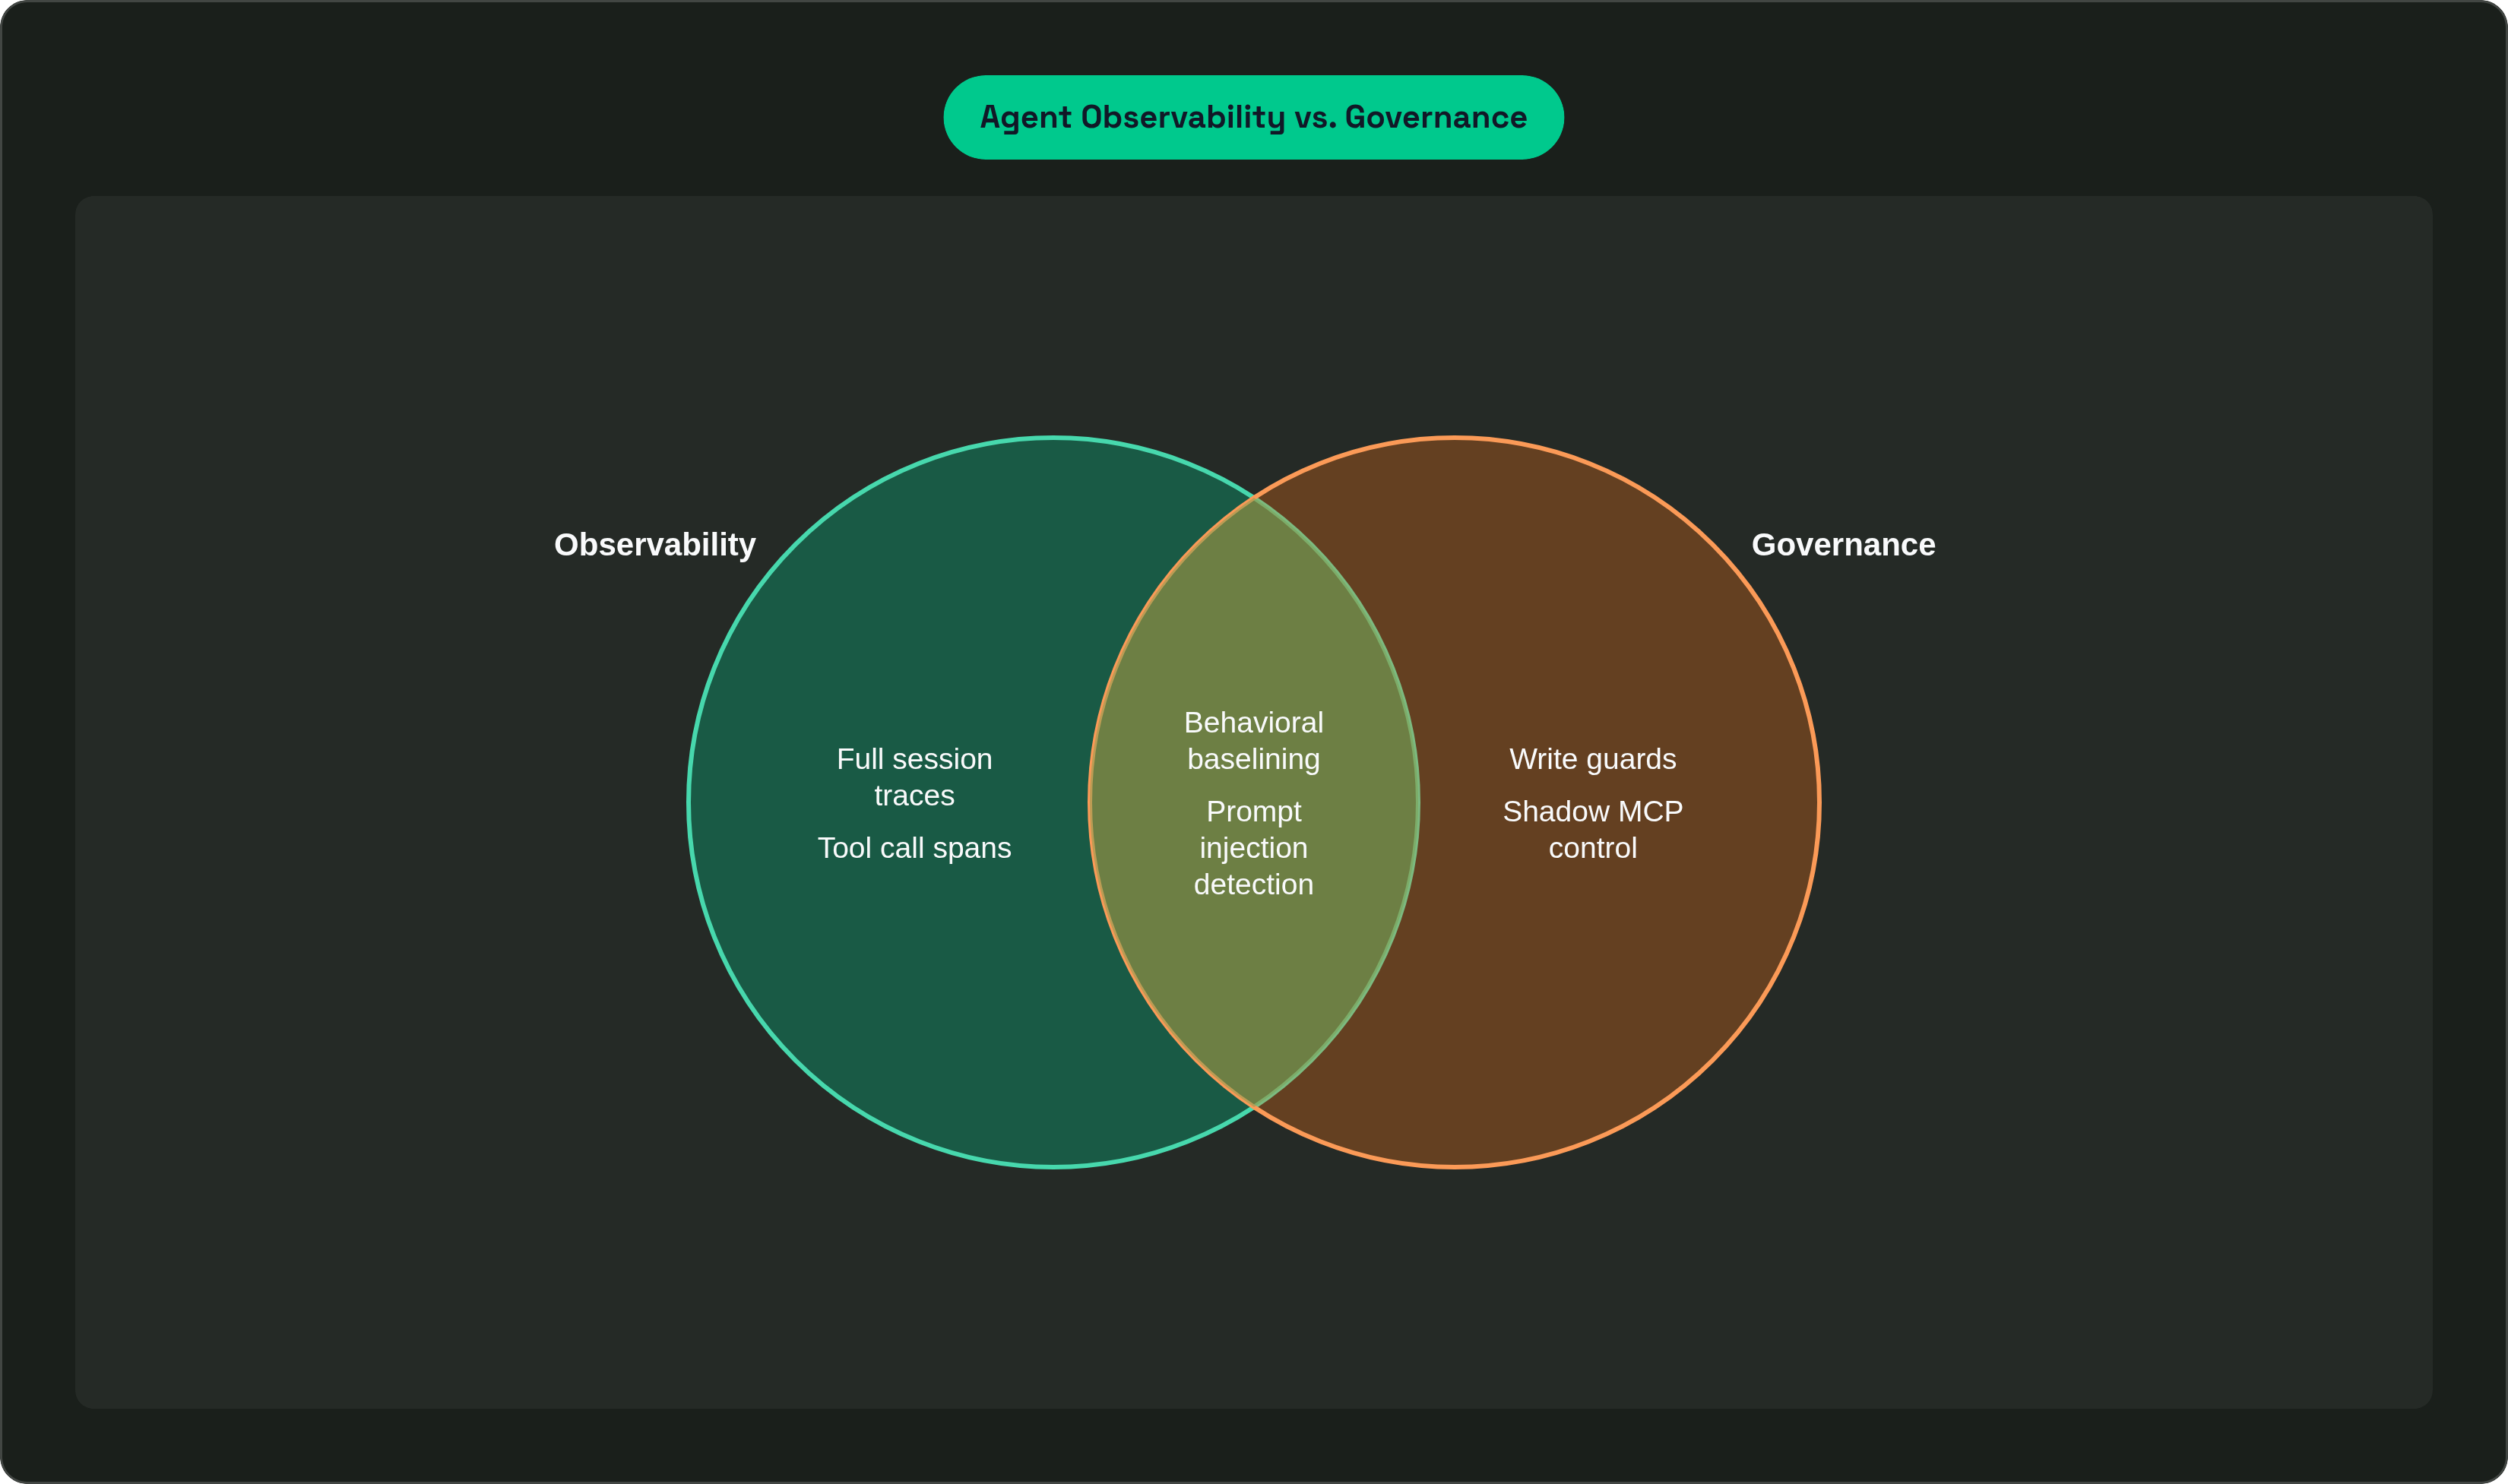
MCP took agentic workflows out of engineering's hands and put them everywhere. Product managers, salespeople, finance analysts, all running MCP-connected agents for daily tasks, and most of that happens with zero visibility from IT into which tools those agents are actually calling.
Call it shadow MCP: the same story as unsanctioned SaaS a decade ago, under a different name. Employees hook up MCP servers on their own, often local deployments pulling from software sources nobody vetted, and IT has no way to audit or shut off what it doesn't know exists. As the number of servers and agents climbs, tracking which agent can call which tool, and under what conditions, turns into a mess no spreadsheet or Slack thread is going to manage.
There's a token efficiency angle buried in here that's also a security angle. Exposing a separate tool for every single API operation burns through context windows fast, and it hands attackers a bigger surface to work with while it's at it. Funneling access through fewer, better-governed interfaces cuts down both problems at once, one of those rare cases where the efficient answer and the safe answer turn out to be the same answer.
A governance-aware setup looks like this: centralized portals where agents discover MCP servers instead of each one hunting on its own, identity-aware access control at the gateway so every tool call ties back to a specific person or agent, and write guards that force explicit policy approval before an agent takes any action with real side effects. Behavioral baselining rounds it out: treat agent traffic as a behavioral signal tied to identity, and flag it when that identity starts acting differently than it usually does. Same logic security teams already use for insider risk, just pointed at agents instead of people.
The principle underneath all of it is simple, even if it's inconvenient. You cannot count on every employee or every developer to configure every agent correctly and watch every tool call by hand; relying on individual diligence at that scale is a hope, not a plan. Governance has to live in the infrastructure layer, enforced by default, rather than left to whatever an individual happened to click through in a setup wizard at 4 p.m. on a Friday. Observability tells you what an agent did and why; governance decides what it was allowed to do in the first place. Neither covers for the other, and at the volume MCP runs at now, you need both watching the same traffic from the same place, or you're not really watching anything at all.