Correlating Logs, Metrics, and Traces Across Multi-Region Deployments
Shared identifiers at generation time unlock multi-region incident investigation.
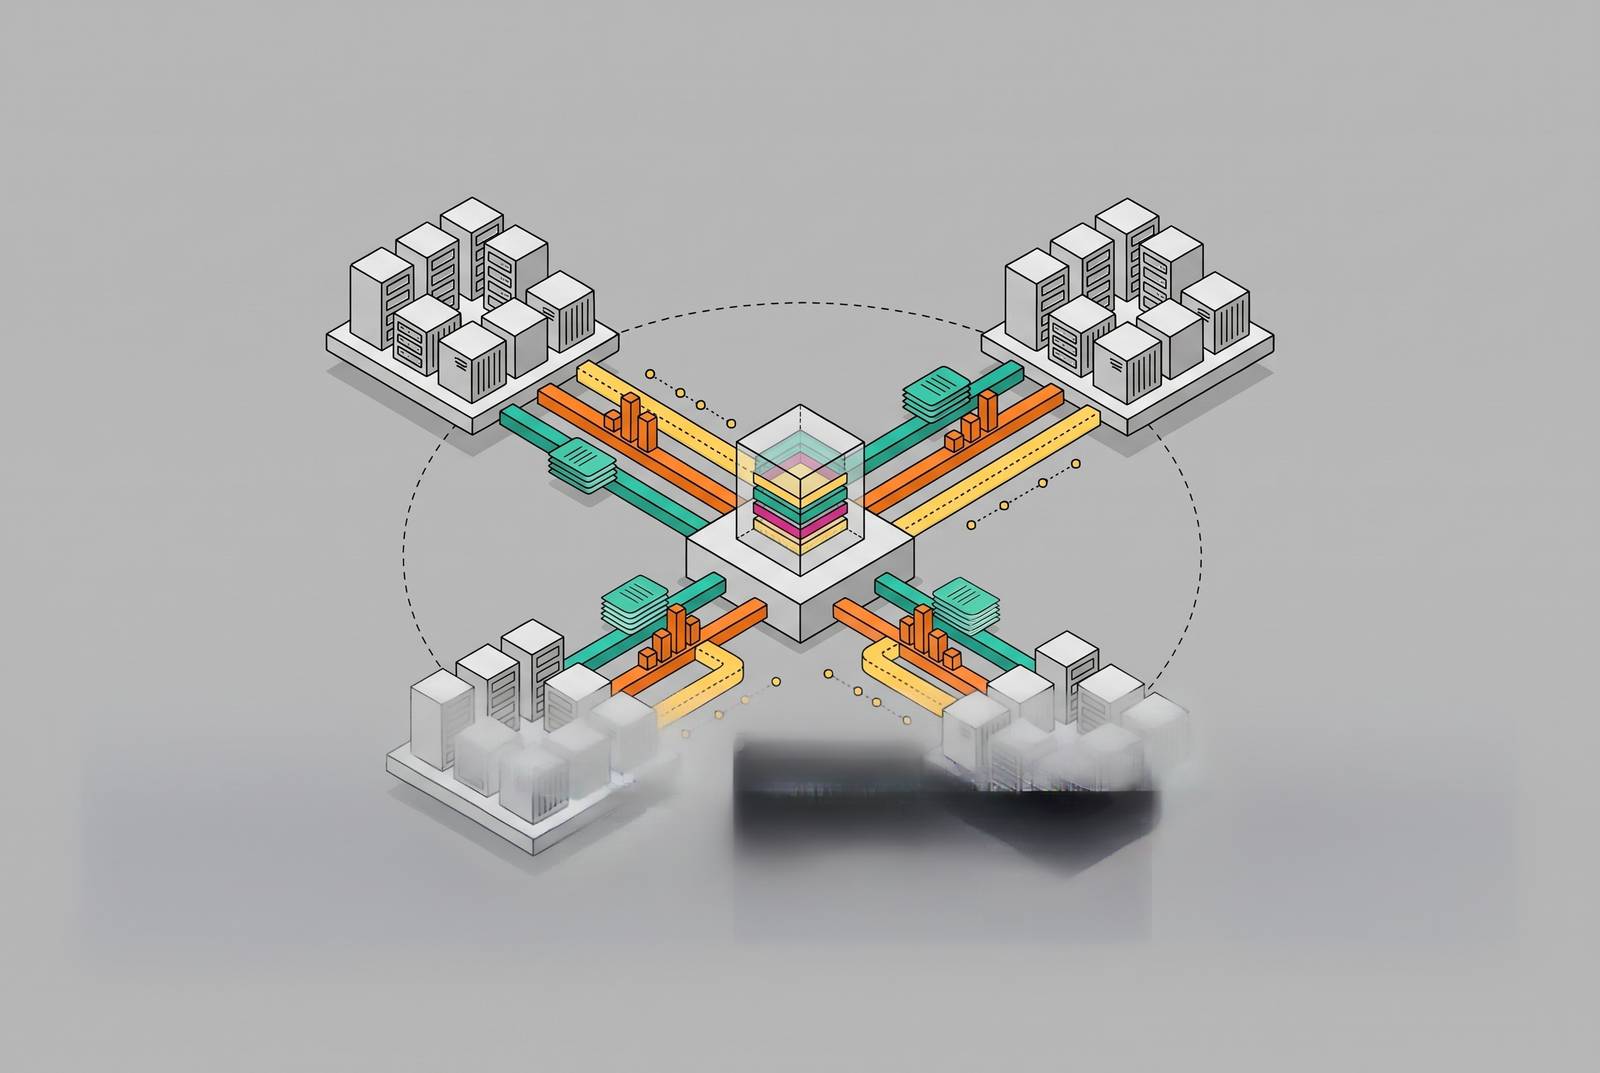
Correlating logs, metrics, and traces across multi-region deployments is an instrumentation architecture problem. The decisive work happens before an incident, when shared identifiers and consistent metadata enter each signal at generation time. Without those links, another dashboard gives the on-call engineer another place to look while leaving what went wrong unclear.
Why multi-region telemetry is fundamentally a correlation problem
An on-call engineer has three consoles that each show part of a failure but have no shared thread. One shows errors on the rise, another shows a downstream timeout, and a third has the logs that might explain it. The engineer starts to match timestamps and switch between screens. That work compounds as the incident continues. The real cost of disconnected telemetry is the manual reconstruction performed precisely when speed is most valuable.
The separation becomes especially costly when a symptom appears in one cloud and its cause lives in another. A spike in 5xx errors in one provider’s region may originate in a timeout on a different provider’s network, while siloed alerts report only the visible symptom. More data does not repair that missing relationship. The structural fix is to make signals joinable from the start, using shared request identifiers and consistent context such as service name, tenant, environment, version, and deployment window. Those links must enter the signals when they are generated.
What each signal type can and cannot do on its own
For an engineer choosing where to begin, metrics are the right first stop when the question is whether something is wrong. Pre-aggregated time series such as request rate, error count, p99 latency, and CPU utilization are cheap to store and fast to query, with retention measured in months to years. Aggregation, however, removes the individual request’s story. Traces are the next stop when the question becomes where a distributed request slowed or failed. Their hierarchy of spans records operations, timing, status, attributes, and parent-child relationships, but sampling makes them a complement to metrics for alerting.
Logs provide the detail once the suspect component is known. They contain the stack trace, offending query, or parameters of a failed call, although that richness becomes expensive at volume. Structured JSON with the same named fields is the basis for cross-service correlation that engineers can rely on. A log line alone still describes only one component. Deployment, failover, and autoscaling events mark state transitions on metric timelines, which can show what triggered a change in behavior.
Why multi-region deployments break the correlation assumptions that work in a single environment
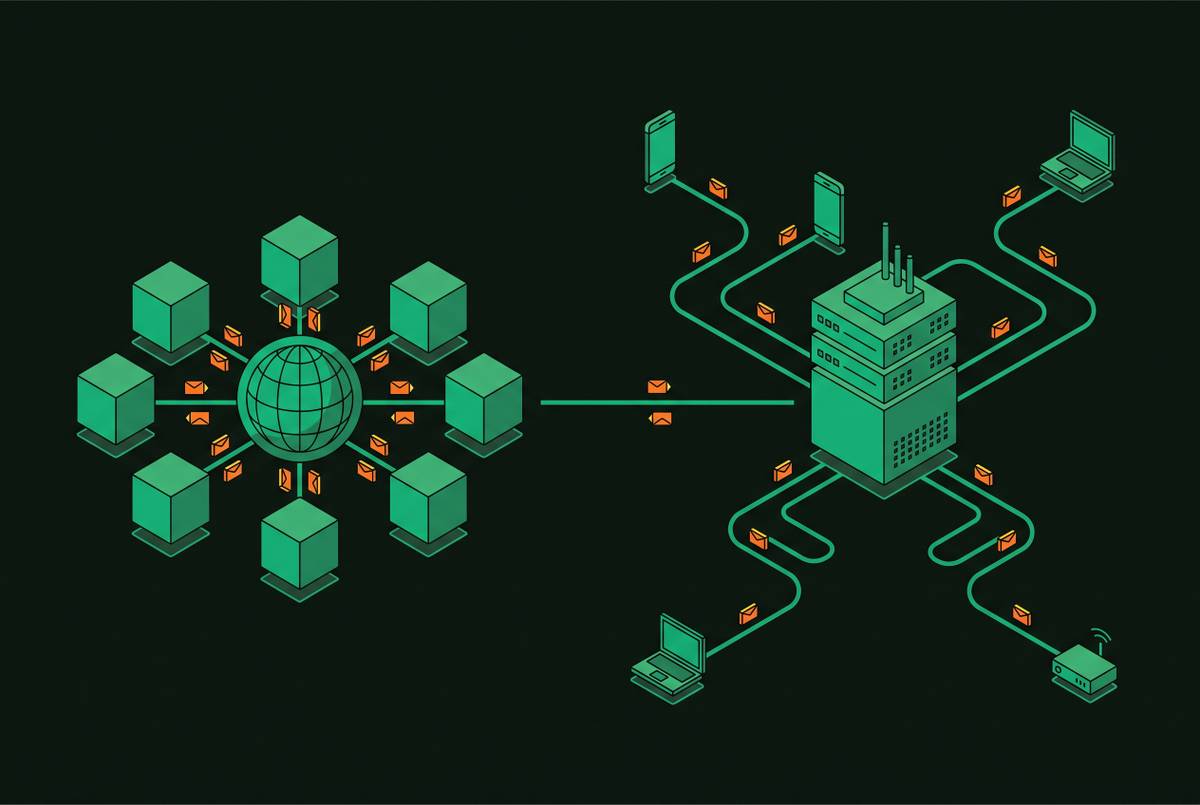
A request that touches an edge function in Frankfurt, a database replica in Amsterdam, and an origin server in Virginia does not fit neatly inside one region’s monitoring view. Its path crosses regions and may cross from one provider to another. AWS CloudWatch, Azure Monitor, and Google Cloud Operations use different schemas, query languages, and identity contexts. When a request traverses all three environments, no single native tool reconstructs the complete transaction path.
Clock skew between regions makes manual timestamp matching uncertain, so NTP synchronization across hosts is the primary correction. Backend clock-skew adjustment, logical clocks, and monotonic clocks can also help, but they do not replace request identity. Meanwhile, traditional APM tools built around one or two centralized cloud regions face topology blindness when requests pass through distributed edge locations. The cross-region path therefore exposes three separate gaps, namely incompatible schemas, misaligned clocks, and incomplete knowledge of the route.
How OpenTelemetry provides a single instrumentation layer across cloud boundaries
OpenTelemetry gives signals a common starting point across those boundaries through a vendor-neutral instrumentation layer, before they reach an analysis backend. That consistency depends on how collection is configured. A production collector must handle backpressure and batching explicitly, with memory limits and batch processor settings to prevent high-throughput pipelines from causing out-of-memory kills in Kubernetes environments. Collection has its own operational limits. When a pipeline fails under load, it can harm the evidence needed to understand that load.
Semantic enrichment adds where the collected data came from and what it means. The attributes processor must tag data points with cloud origin, for example by setting cloud.provider to aws, so a unified view can distinguish otherwise similar signals from different clouds. Transport also needs an explicit security design. OTLP supports transport to a centralized backend, while the backend defines authentication, such as an API key.
Injecting shared identifiers at signal generation, not at query time
Context propagation turns that common instrumentation layer into a correlation system. A trace ID shows which distributed request it is, while span IDs show which operations are within it. Logs and request-level metrics need links to the right trace and span, because identifiers that happen to look similar do not establish those links. The association must exist before the signal leaves the application. A query can follow an explicit relationship, but it cannot recover one that was never recorded.
In practice, every log line needs trace_id and span_id as named JSON fields. Metrics emitted during a request should include those identifiers where label cardinality permits. Consistent resource attributes provide the broader filtering vocabulary, including service.name, team, version, commit_sha, deployment_id, env, region, and cluster. These fields do a different job from request identity. They let an engineer narrow an investigation to a service, deployment, or region without losing the links between signal types.
For the cross-region request, that design begins at the edge. A Request ID propagates from edge to origin, appears in structured logs with per-hop latencies, cache hits, and error codes, and accompanies trace context headers that make the edge work visible in end-to-end tracing. If a latency metric exposes a spike, the engineer can follow its recorded link into the corresponding trace, locate the failing span, and open the exact associated logs without re-entering identifiers.
The debugging sequence follows the evidence’s level of detail. Metrics show that the symptom is there, traces show the call path that failed, and logs explain what went wrong in the component. Events then help identify a release, scaling action, or dependency outage that triggered the change. This sequence requires the evidence retained at each level to remain connected to the next.
Sampling strategy as a cost and fidelity decision, not an afterthought
Full-fidelity telemetry across many edge locations is not economically viable at scale. Sampling therefore belongs in the architecture. Metrics are generally cheapest because they aggregate observations, logs are most expensive because of their verbosity, and traces sit between them but can grow costly without a policy. Retention compounds those differences. Metrics can be useful for months to years, while logs are often kept for days to months and traces for days to weeks, though sampling lets teams keep traces for longer.
The goal is to keep error and degraded-request evidence at full fidelity while lowering the sampling rate when things are running normally. Cardinality needs equal discipline, because unbounded metric labels such as user_id or request_path can multiply time series and overwhelm query performance. User IDs and session tokens on spans can also drive cost upward without sampling controls. Label sanitization, structured logging, and trace sampling policies therefore need to be defined before production rollout.
When signals use standard formats before leaving a cloud boundary, high-volume debug logs can be routed to cheaper object storage while critical signals go to the analytics backend. Routing becomes a deliberate economic choice.
Extending correlation architecture to AI agent workflows
AI agent workflows extend the same problem beyond conventional service calls. A production session may have multi-step reasoning loops, tool calls, model invocations, and state transitions that need end-to-end tracing. Each needs a place in the record. Agent spans, tool calls, and model invocations should thus keep trace and span identifiers along with business metadata such as user_id and workflow_id, with the same cost controls used elsewhere.
The OpenTelemetry GenAI semantic specification is the emerging vendor-neutral standard for describing this wider set of operations. It covers model-call, agent, workflow, and tool-execution spans, together with embeddings, retrieval, MCP conventions, semantic events, metrics, and provider-specific attributes. The new requirement is decision provenance. Reconstructing the inputs, recorded reasoning steps, and outputs behind a decision requires span-per-tick tracing from the outset, just as reconstructing a service failure requires links created before the incident.
Missing decision evidence cannot be supplied by a later dashboard. A language model that keeps checking sampled production traces can detect semantic drift, much as threshold alerting does in conventional monitoring. In this setting, the recorded workflow supports both fault investigation and evaluation of whether the agent’s behavior is changing.
How a globally distributed network layer changes what correlation data is available
The network is the earliest opportunity to give a request its correlation anchor. An edge platform that propagates trace context headers from the first point of presence lets downstream services inherit that context. A fragmented network stack can lose this advantage. Separate CDN, WAF, and DDoS components may each log independently without a shared request identifier, recreating cloud-level silos before the request reaches the application.
A unified edge platform handling DDoS mitigation, WAF inspection, and routing at one network node can make that portion of the path visible. It can record a consistent Request ID in structured logs with per-hop latencies, cache hits, and error codes, then propagate trace context downstream. Placement affects what evidence is available. The design goal is proximity to both users and origin data, with detection and logging at the point of presence serving the request rather than at a separate centralized observability hop.
That network context becomes useful when it matches the investigation engineers actually perform. Kmart aligned observability views with how its teams debugged checkout issues, reducing the gap between an alert and the right engineering context. An edge-to-origin view depends on consistent instrumentation across the request path.
Building the operational workflow that makes correlation usable under pressure
Monitoring should start with the questions engineers ask during an incident and work back to the dashboard widgets they have available. Whether a failure affects users is answered by metrics tied to business outcomes, including conversion rate and successful API calls. Which services are involved is answered by trace-derived service maps with consistent service.name attributes. Whether a recent deployment explains the change requires deployment events on metric timelines. Each question depends on a different part of the shared schema.
The alert-to-trace-to-log path must be a designed workflow. An alert starts with a metric, its recorded trace identifier leads to the relevant request, and the failing span links to its exact log lines. Context-aware alerting protects that workflow from noise by focusing on user-impacting symptoms. Static thresholds alone fit poorly with daily traffic patterns, autoscaling, and frequent releases. Continuous synthetic checks in each target region provide the proactive complement, exposing routing errors and regional degradation before real users encounter them.
A mature program lets an engineer filter combinations of metrics, logs, and traces by environment, region, customer tier, or deployment version in one query. That capability begins with instrumentation. Under pressure, the advantage belongs not to the team with the most tools, but to the team whose signals already speak the same language when the incident begins.