OpenTelemetry Collector Deployment Patterns for Distributed Services
Agents and gateways divide collection labor to handle scale, security, and cost as systems grow.
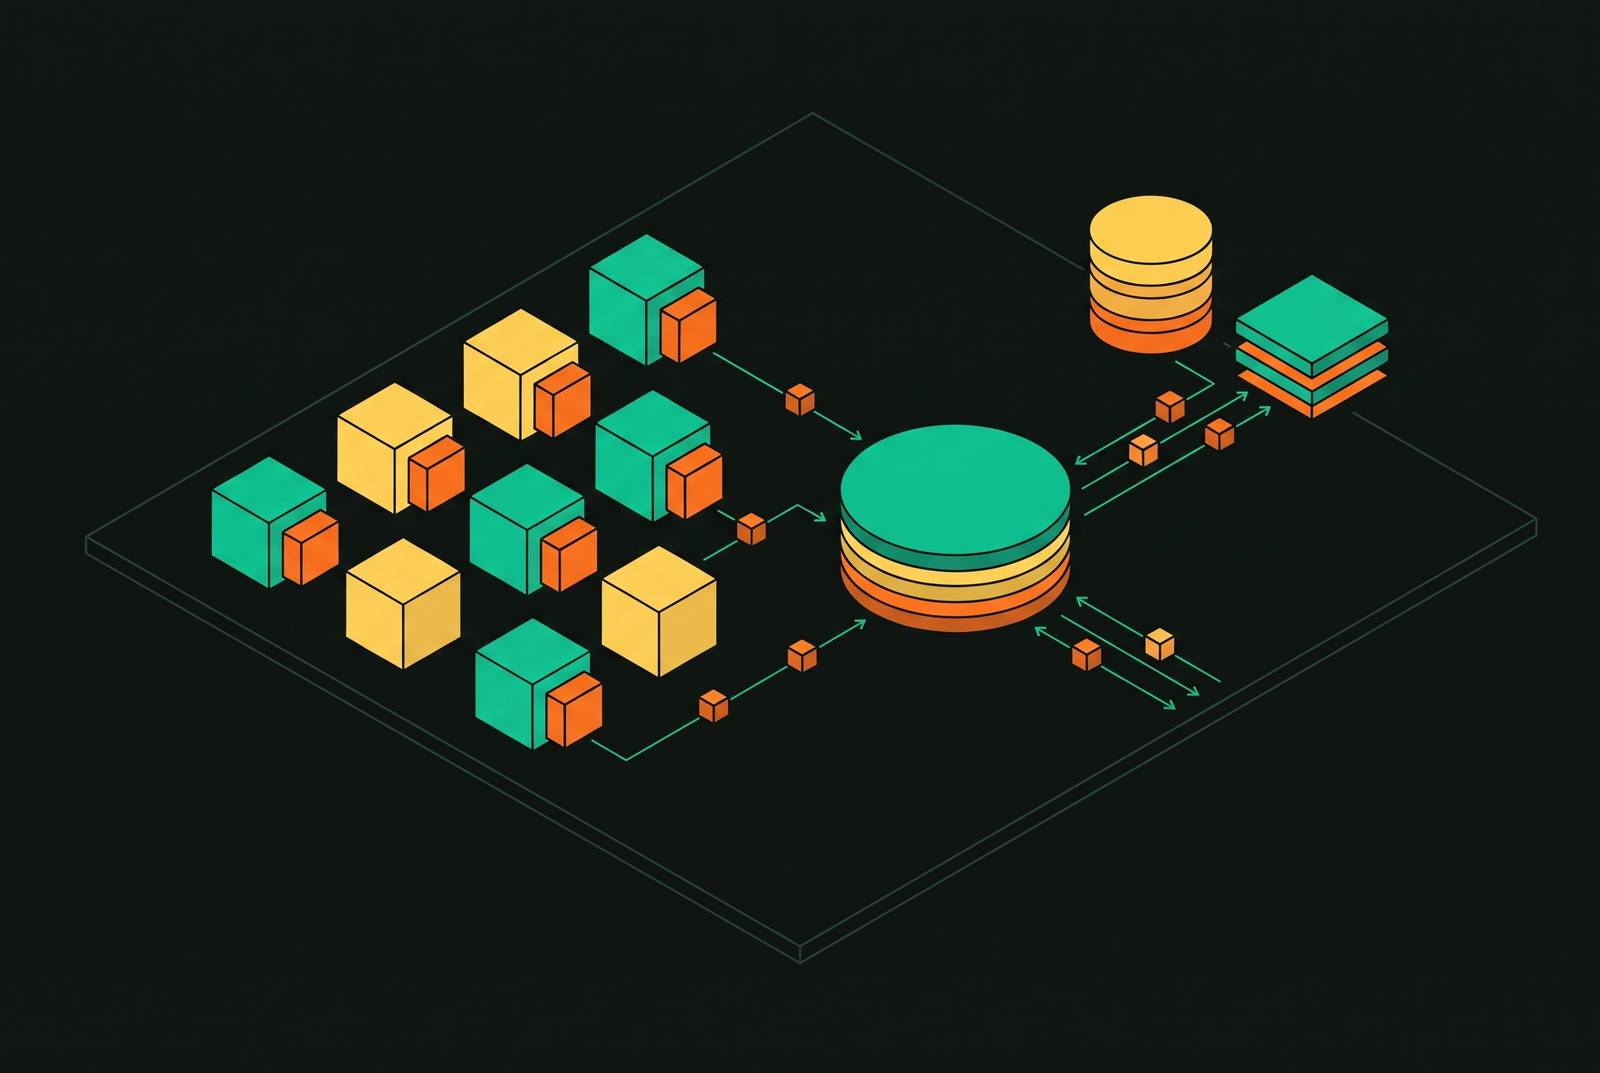
OpenTelemetry Collector deployment is a choice about where complexity belongs. Agent, gateway, and hybrid patterns trade local collection against shared processing, scale, and cost control. For most teams growing beyond a single instance, agents feeding a gateway pool provide the strongest default because they keep collection close to applications while concentrating policy where it can be managed.
Why the single-Collector setup that worked at launch stops working as services multiply
The configuration that felt like the future at launch can quietly become a bottleneck waiting to happen. A handful of services becomes a distributed system, but every trace, metric, and log still passes through one process. That process is now a single point of failure. Meanwhile, backend credentials multiply across clusters, tail sampling demands more state, and unfiltered exports turn telemetry growth into an ungoverned bill.
A survey of OpenTelemetry Collector users found that 65% of surveyed teams run more than ten Collectors in production, with Kubernetes the dominant environment. The Collector’s vendor-neutral promise to receive, process, and export telemetry remains the same. The topology must now absorb scale without handing the complexity back to applications.
The three deployment patterns and what each one is actually optimizing for
The agent pattern puts a Collector on every node as a DaemonSet or in every pod as a sidecar. Collecting data locally means it travels less over the network and allows for lightweight processing. The survey found that 50% of Kubernetes users report using DaemonSets, the node-level default. Applications find the node through status.hostIP, which is exposed as NODE_IP, and send to $(NODE_IP):4317. The agent can collect node-level signals through kubelet, filelog, and hostmetrics that a sidecar cannot see.
A sidecar instead provides per-workload configuration isolation and a pure localhost endpoint. Isolation comes with more containers to run. The OpenTelemetry Operator injects it through the sidecar.opentelemetry.io/inject annotation on spec.template.metadata.annotations and sets OTEL_RESOURCE_ATTRIBUTES automatically. Because each pod has its own Collector, sidecars cost more than DaemonSets to collect data across a node. Neither local arrangement alone solves cross-host aggregation, centralised credentials, or shared export policy.
The gateway pattern puts identical, stateless Collectors behind a load balancer so the fleet can keep running if one instance fails. Capacity grows by adding instances. It favours high availability and zero-downtime rolling updates. Stateful processors complicate that otherwise straightforward arrangement, however. Tail sampling requires a trace’s spans to reach the same instance, so random distribution across the fleet is unsafe.
DaemonSet agents collect locally and perform basic processing, while gateways enforce policy, manage backend credentials, run tail sampling, and export. This separates collection from decisions about what leaves the system. These are distinct tradeoffs. The choice depends on whether local access, workload isolation, shared processing, or operational simplicity is the immediate priority.
Why the agent-plus-gateway topology becomes the production default for most teams
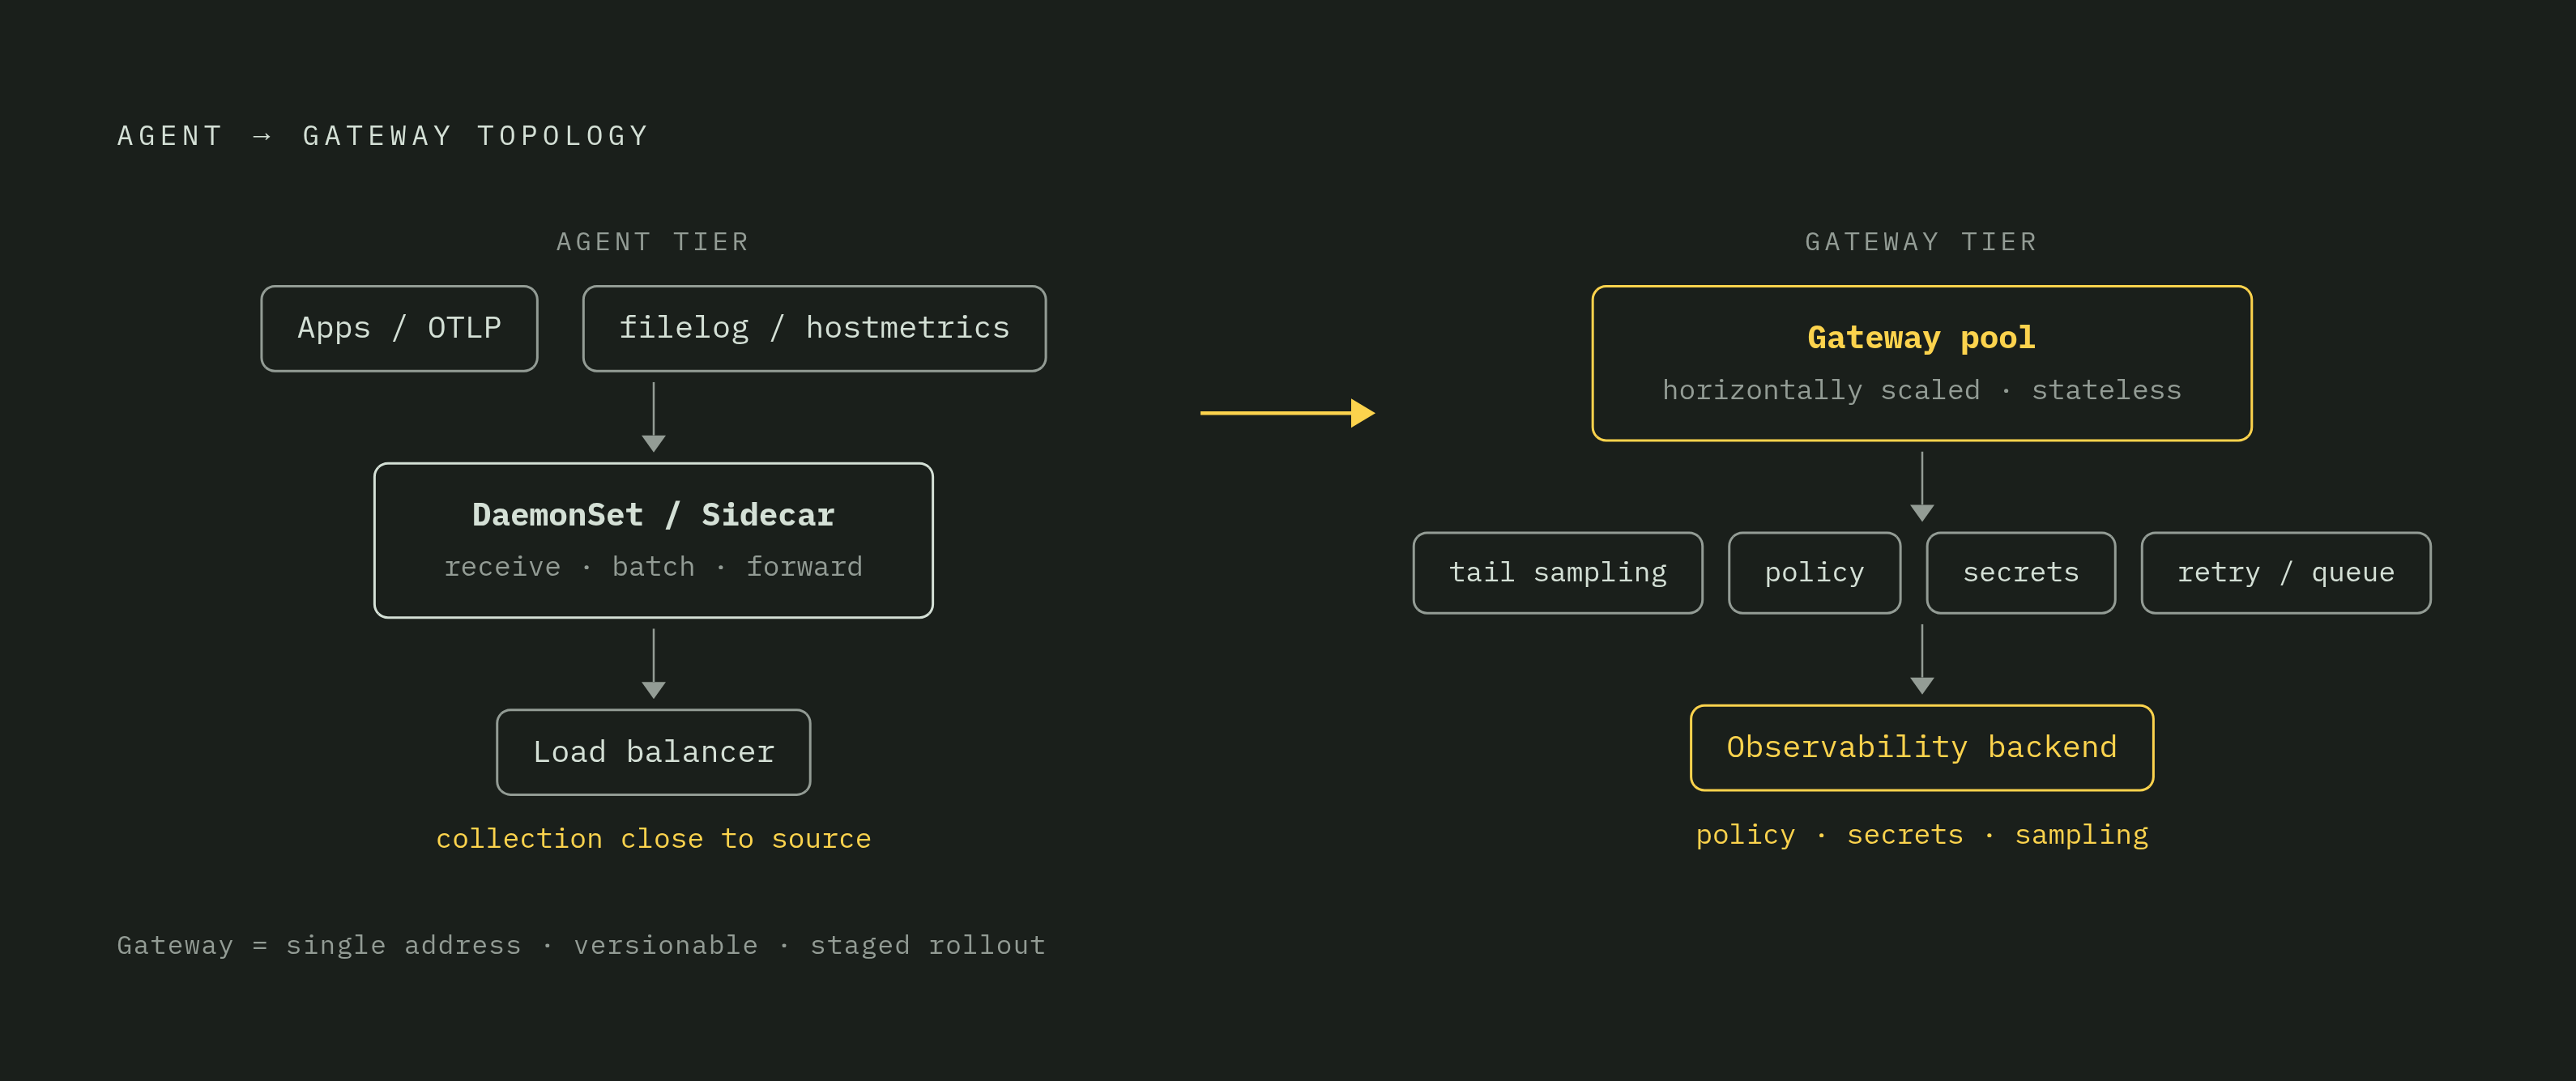
The structural advantage of two tiers is a precise division of labour. Agents receive application telemetry through OTLP, pull infrastructure signals through filelog and hostmetrics, then batch and forward. Their configurations stay small and their processing stays stateless. Gateways own heavy processors, sampling policy, backend credentials, retries, and persistence. Complexity has not vanished. It has acquired an address where it can be monitored, versioned, and rolled out in stages.
That concentration also reduces the spread of secrets. When every cluster authenticates directly to the backend, the attack surface grows with cluster count. A shared gateway authenticates for upstream agents, so teams can control this in one place. Its persistent queues, backed by a write-ahead log, also protect against backend outages without requiring an external message queue at moderate scale.
The survey found that 58% of Kubernetes users report using the gateway pattern, so shared processing is now common. Multi-cluster deployments extend the same logic. In-cluster gateways collect telemetry and attach cluster metadata, then feed a regional aggregation gateway that holds backend secrets and enforces global rules. The most powerful processor concentrated there is also the most demanding to operate safely, namely tail sampling.
Tail sampling at the gateway and its operational cost
A gateway must buffer every in-flight trace while it waits to decide whether to keep it. As more traces come in, that state takes up a lot of memory. Elastic’s upstream contributions address this problem through the span-ingest sampling strategy and disk buffering in a Pebble LSM database via pebbletailstorageextension. Together, they cut memory usage by up to 65%, at a cost of roughly doubled CPU.
The reason to accept that overhead is hindsight. Head sampling decides before it knows how a request turned out, while tail sampling can choose traces based on their errors or latency. Agents forward all spans upstream, and the gateway groups them by trace ID until decision_wait elapses. It then evaluates policy and keeps or drops the trace. The recommended policy retains all error traces and traces above a latency threshold, with a probabilistic fallback of roughly 5–10% for everything else.
The waiting window is an operational commitment. Sampling that is sized badly can cause out-of-memory kills, and spans that arrive late can leave broken traces. Downstream metrics can also be biased if they do not account for sampling rates. Disk buffering lets operators raise decision_wait and num_traces with less memory pressure, but the CPU and storage must do more work. Hindsight is useful, but it is not free.
Random load balancing scatters one trace’s spans among instances, leaving each sampler with only part of the evidence. The solution is trace-ID-aware routing. A loadbalancing exporter on the agent tier consistently hashes each trace ID to the same gateway instance, giving that instance the spans needed for its decision.
Cost control at the Collector and the techniques teams commonly skip
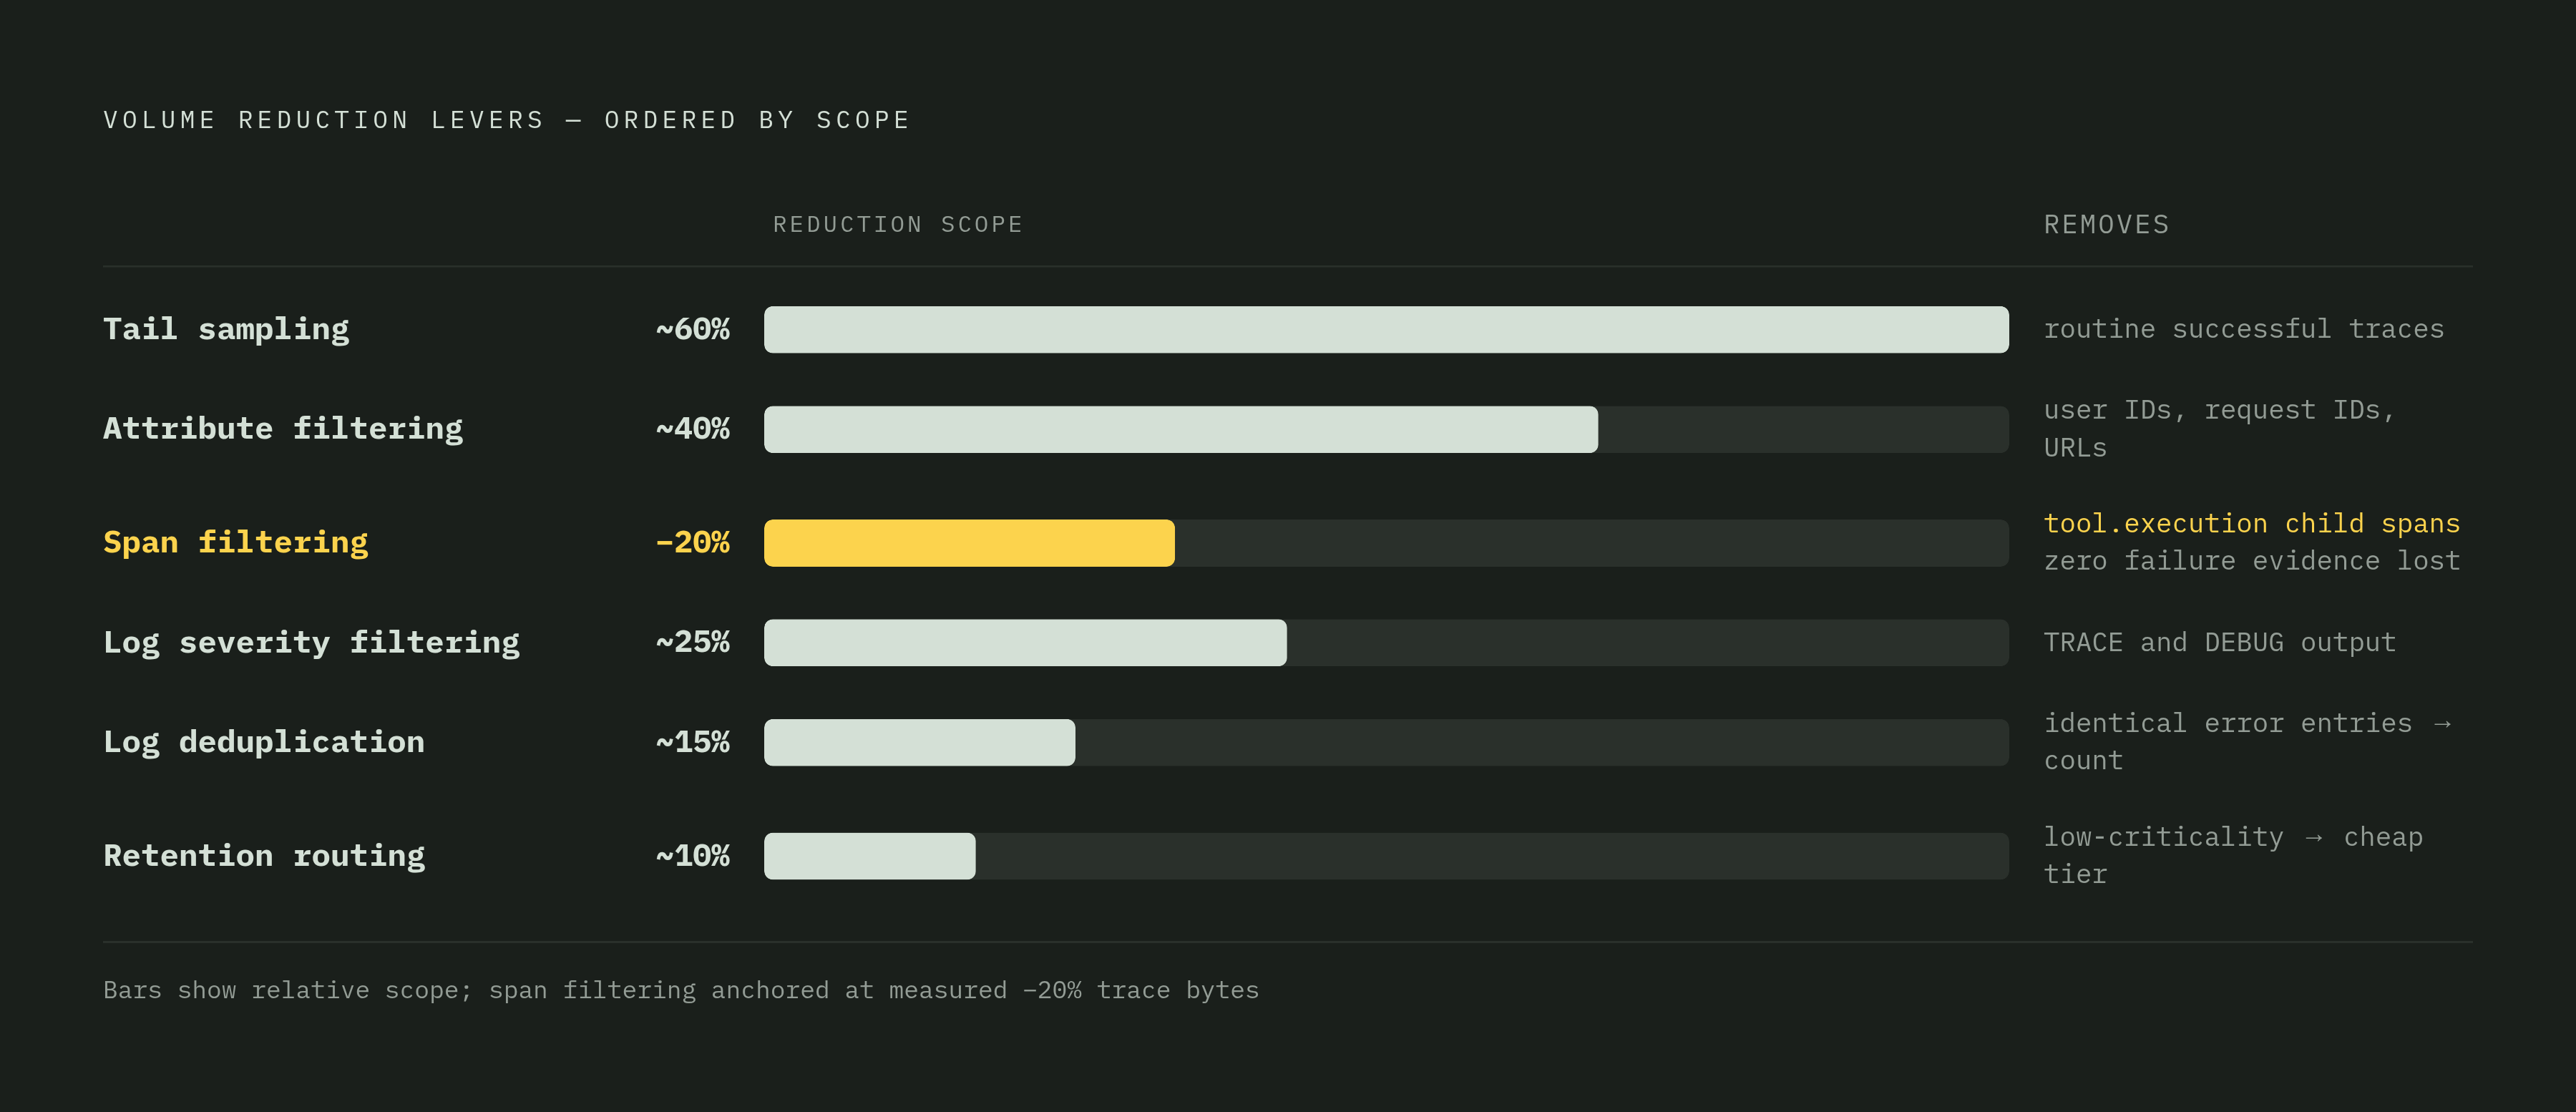
The Collector is the last place to reject telemetry before it is shipped and billed. Sending everything to the backend asks the most expensive part of the pipeline to sort out what was worth sending. Filtering earlier changes that equation. The purpose is not indiscriminate deletion, but keeping diagnostic evidence while removing routine volume that contributes little to an investigation.
Five levers work together to reduce that volume. Tail sampling retains errors and slow traces while sampling routine success. Attribute filtering strips high-cardinality labels such as user IDs, request IDs, and full URLs that inflate metric cost without improving debuggability. Log severity filtering drops the TRACE and DEBUG output that comes from production. Repetitive log sampling keeps an error occurring thousands of times per minute from producing thousands of identical entries when a count is sufficient. Retention-tier routing sends high-frequency, low-criticality signals to cheaper storage outside the primary backend.
A CNCF case study makes the distinction concrete. Dropping successful tool.execution child spans removes a fifth of trace bytes without sampling because their parent already contains tool_name, duration_ms, and result_tokens. The child remains useful on failure, so those spans stay. No failure evidence needs to be sacrificed for this reduction.
The objection to filtering is legitimate but incomplete. Data dropped today might have helped tomorrow, but repeated successes still differ in how much they can help explain a problem. Keeping error and anomalous traces while removing low-signal bulk protects the evidence used in incident resolution.
When a message queue between agents and the gateway is justified
An external queue is justified when spikes overwhelm gateways faster than the fleet can scale, or when at-least-once durability is a hard requirement that gateway persistence alone cannot satisfy. Agents publish to a persistent message queue, and a separate aggregator Collector fleet consumes from it before exporting to backends. Apache Kafka is one option for this pattern, which decouples production from consumption and lets consumers scale independently.
That separation introduces another system to operate, monitor, and size. It also adds latency because telemetry must be produced, queued, and consumed before reaching the backend. The queue is not free insurance. Teams should use all the gateway’s write-ahead-log option can offer before adding a tier for durability or spike-handling that they truly need.
Observability for AI agents changes what the Collector pipeline must handle
Tool calls, LLM roundtrips, and multi-step agent spans produce more traces per request. Prompt and completion text can be orders of magnitude larger than ordinary span attributes. That content may also have personally identifiable information in it.
The OpenTelemetry Generative AI Observability SIG began work in April 2024 to standardise attributes, span types, and metrics. As of early 2026, its conventions cover LLM client spans, agent spans, prompt and completion events, and metrics. Content capture is opt-in and disabled by default. Collectors can strip content while keeping its metrics, normalise GenAI attributes, remove fields that are not allowed, and send development and production data to different backends. Teams have to configure those controls for them to take effect.
For teams adopting this telemetry, the recommended production posture is metadata-only logging. Full prompt and tool content should be opt-in, short-lived, access-controlled, and redacted first at the SDK and again at the Collector. Defence in depth applies to text, too. Because inference calls cross regions and use external model APIs, the gateway’s policy checkpoint helps control both costs and where sensitive content can go.
Securing the Collector pipeline with workload identity instead of static credentials
Centralising backend credentials reduces their spread but leaves a persistent secret worth stealing. Workload identity removes that standing secret. Red Hat’s April 2026 production pattern demonstrates a secretless OpenTelemetry pipeline using SPIFFE/SPIRE workload identity. The SPIFFE helper requests and stores short-lived SVIDs, or SPIFFE Verifiable Identity Documents, as X.509 certificates or JWT tokens in place of static API tokens.
The receiving Collector validates the client’s cryptographic identity, extracts its SPIFFE ID, and appends that identity to the telemetry payload. Identity therefore survives beyond the transport check. Strict identity-based access controls replace username/password or static-token schemes throughout the pipeline. This aligns telemetry with Zero Trust principles through continuous identity verification and no standing secrets. Because verified identity becomes part of the data, the gateway can also condition routing and filtering on the originating workload.
Managing a large Collector fleet with OpAMP instead of per-host configuration changes
A policy change becomes a different task when it must reach dozens or hundreds of Collectors. Agents, gateways, VMs, and embedded devices create a configuration problem that topology alone cannot solve. The survey found that 63% of users cite configuration management and resolution as an improvement request, making it the leading concern. Manual SSH and per-cluster redeploys do not make that concern smaller.
OpAMP provides a protocol for a central server to push configuration, monitor health, and stage changes across the fleet. Hosts no longer need individual attention for each rollout. Its scope ranges from a pair of large gateways to embedded devices, point-of-sale machines, and laptops collecting Windows events for security tracking. That breadth makes a common control plane useful beyond Kubernetes.
The OpAMP Gateway Extension addresses the next management bottleneck. Announced in alpha at KubeCon Europe Amsterdam 2026, it intermediates WebSocket connections when tens of thousands of Collectors would otherwise connect directly to the management plane. Once fleet configuration is tractable, however, the remaining constraint is where those Collectors run and how data reaches them.
How the Collector pipeline connects to the network and compute layer underneath it
Multi-tier designs assume reliable, low-latency paths between agents, gateways, and backends. Concentrating gateways in one region while workloads are distributed globally can break that assumption. Geography becomes part of the processing budget. When the agent-to-gateway path is slower, the decision_wait window must be wider, tail sampling needs more memory, and filtering takes longer. The processors cannot compensate for distance simply because the configuration is correct.
AI telemetry makes placement more consequential because inference crosses regions while content requires governance before export. Teams should audit the physical locations of agents, gateway instances, and observability backends relative to users and workloads. Geographic mismatch deserves the same priority as sampling policy or credential management. A globally distributed pipeline needs an appropriately distributed, low-latency network and compute layer underneath it. Otherwise, the topology is well organised only on paper.